
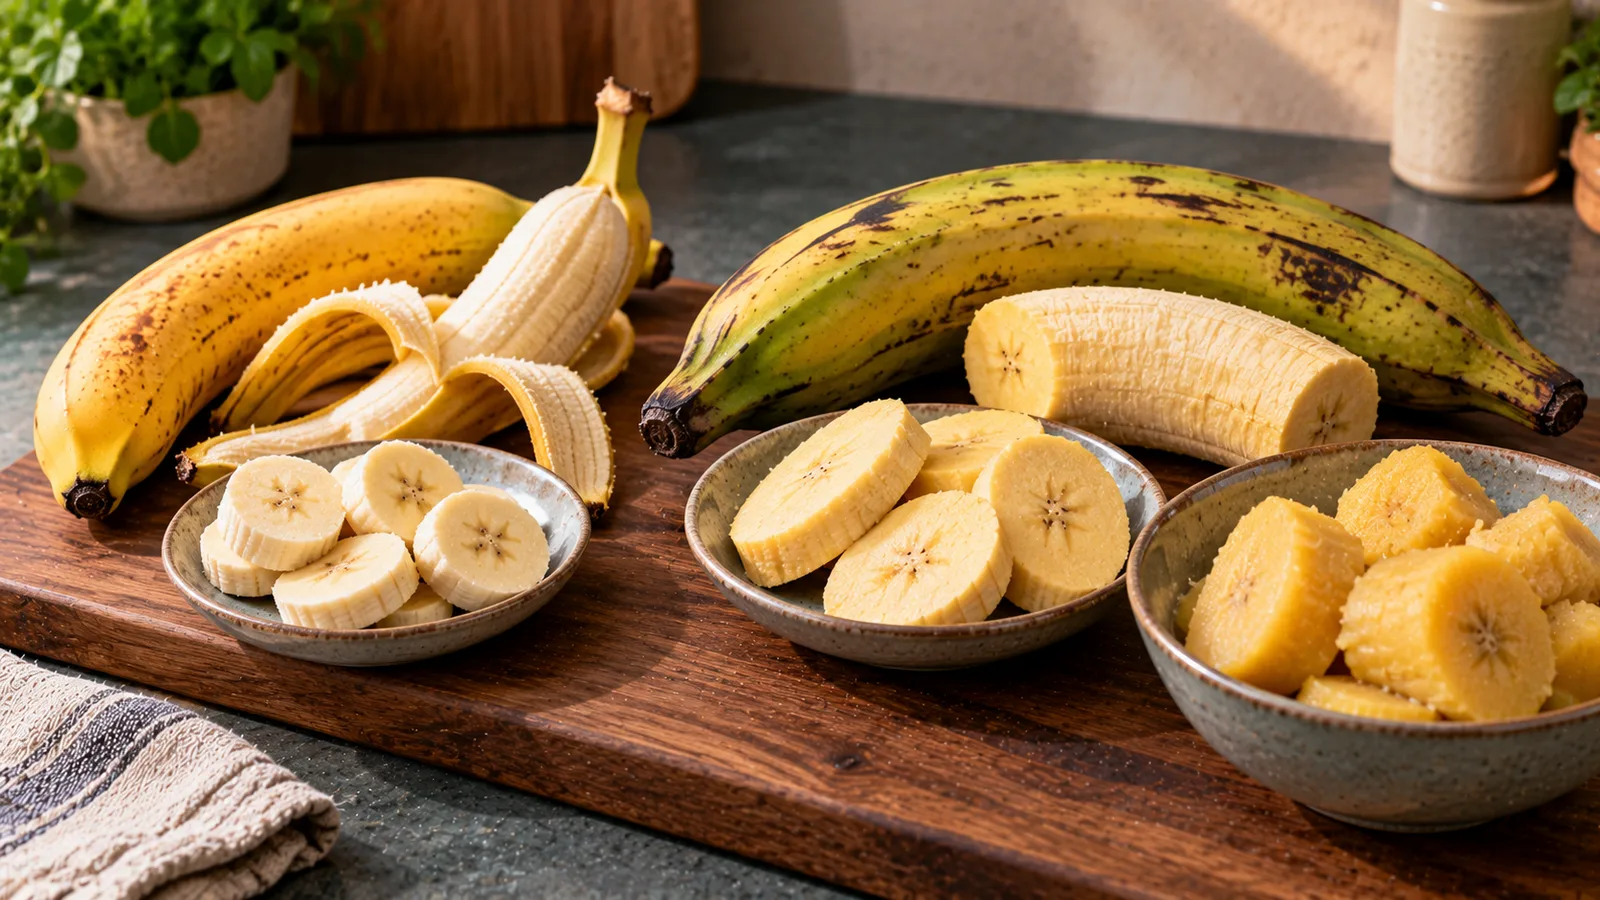
Banana vs Plantain: Carbs in Raw and Cooked 150 g Portions
Compare carbs for banana and green or yellow plantain at equal 150 g edible weights. USDA figures, boiled yield cautions and practical food logging.
Read article →Clear comparisons of foods, nutrition approaches and useful tools.
Compare carbs for banana and green or yellow plantain at equal 150 g edible weights. USDA figures, boiled yield cautions and practical food logging.
Read article →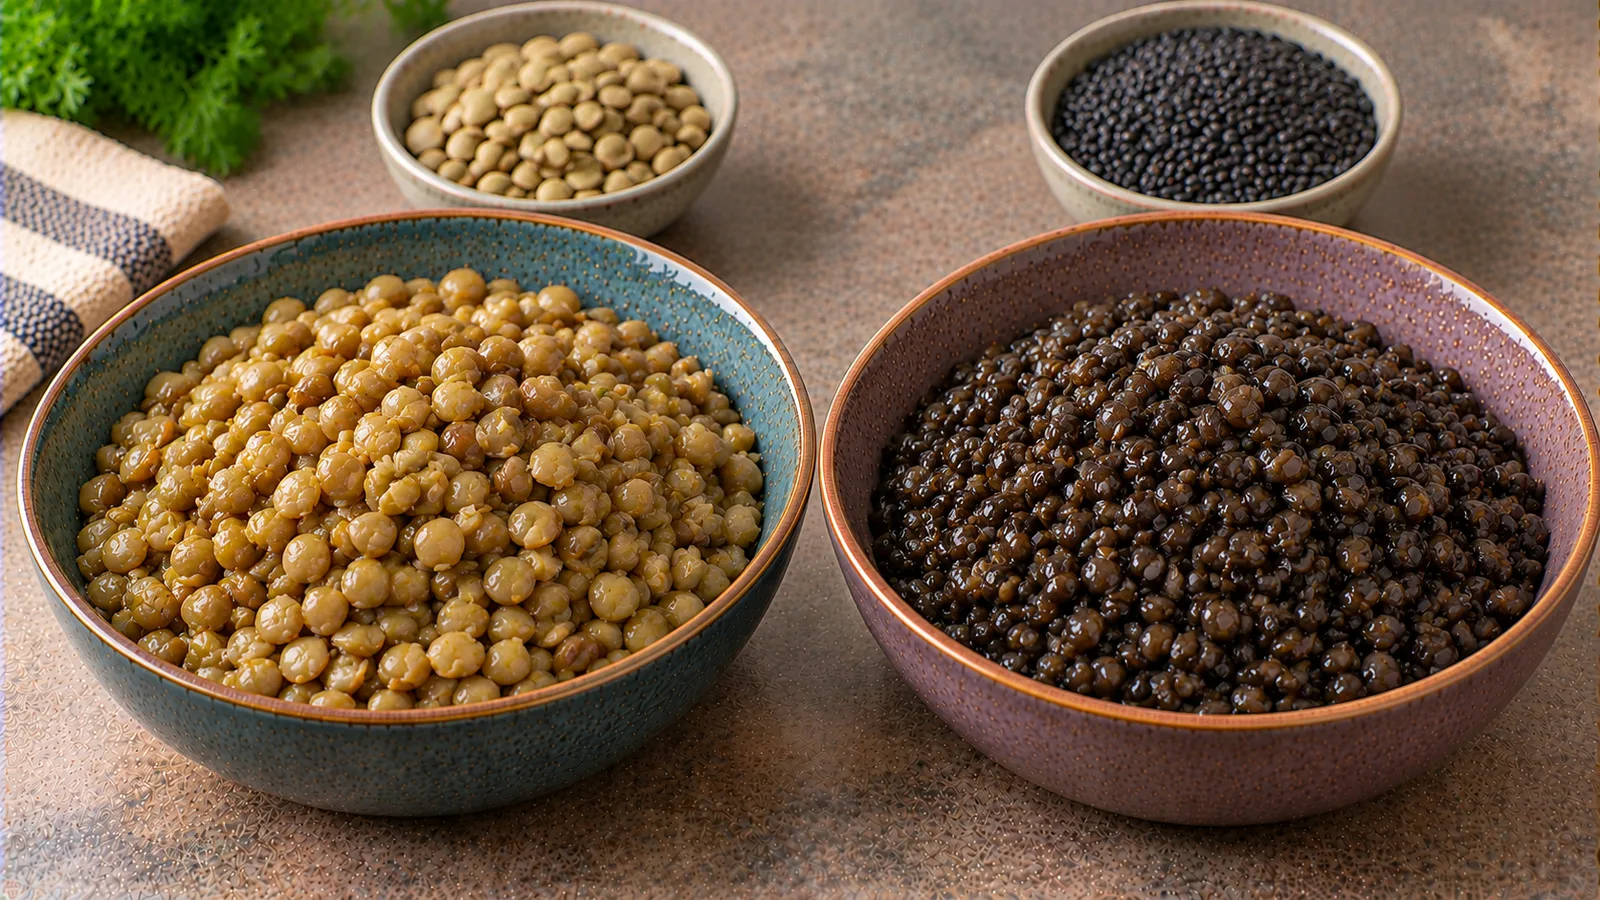
A reproducible label-based comparison of green lentils and black Beluga lentils: cooking instructions, dry-fiber content and portion costs, without confusing cooked and dry weights.
Read article →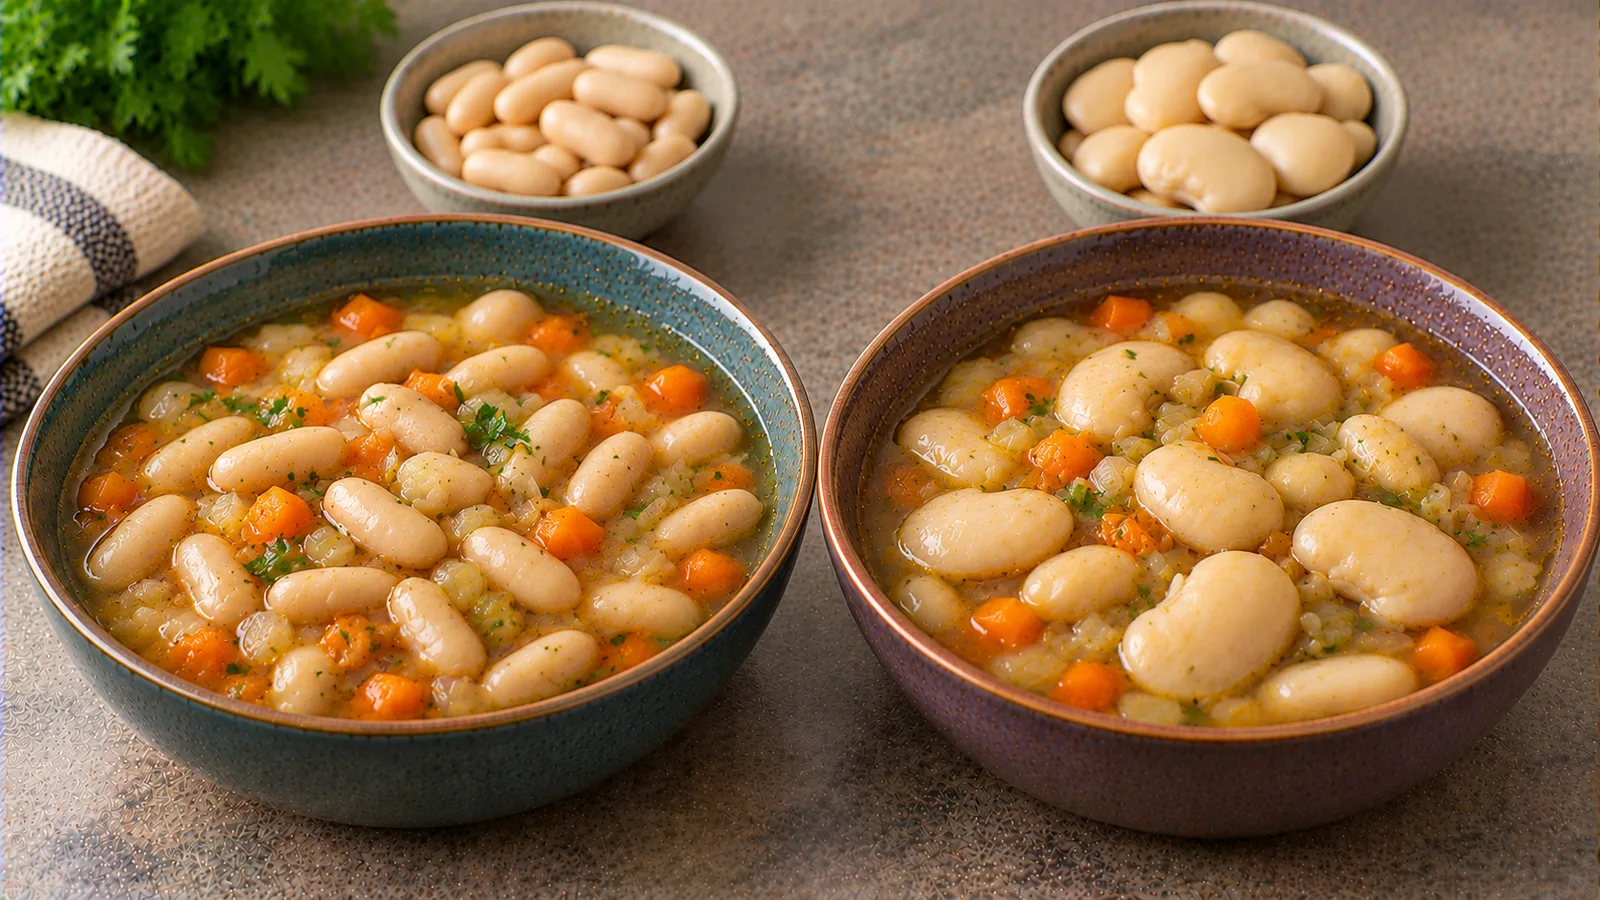
Compare two specified canned beans for soup using protein, fiber, texture and cost per 150 g of drained beans—not per 150 g of finished soup.
Read article →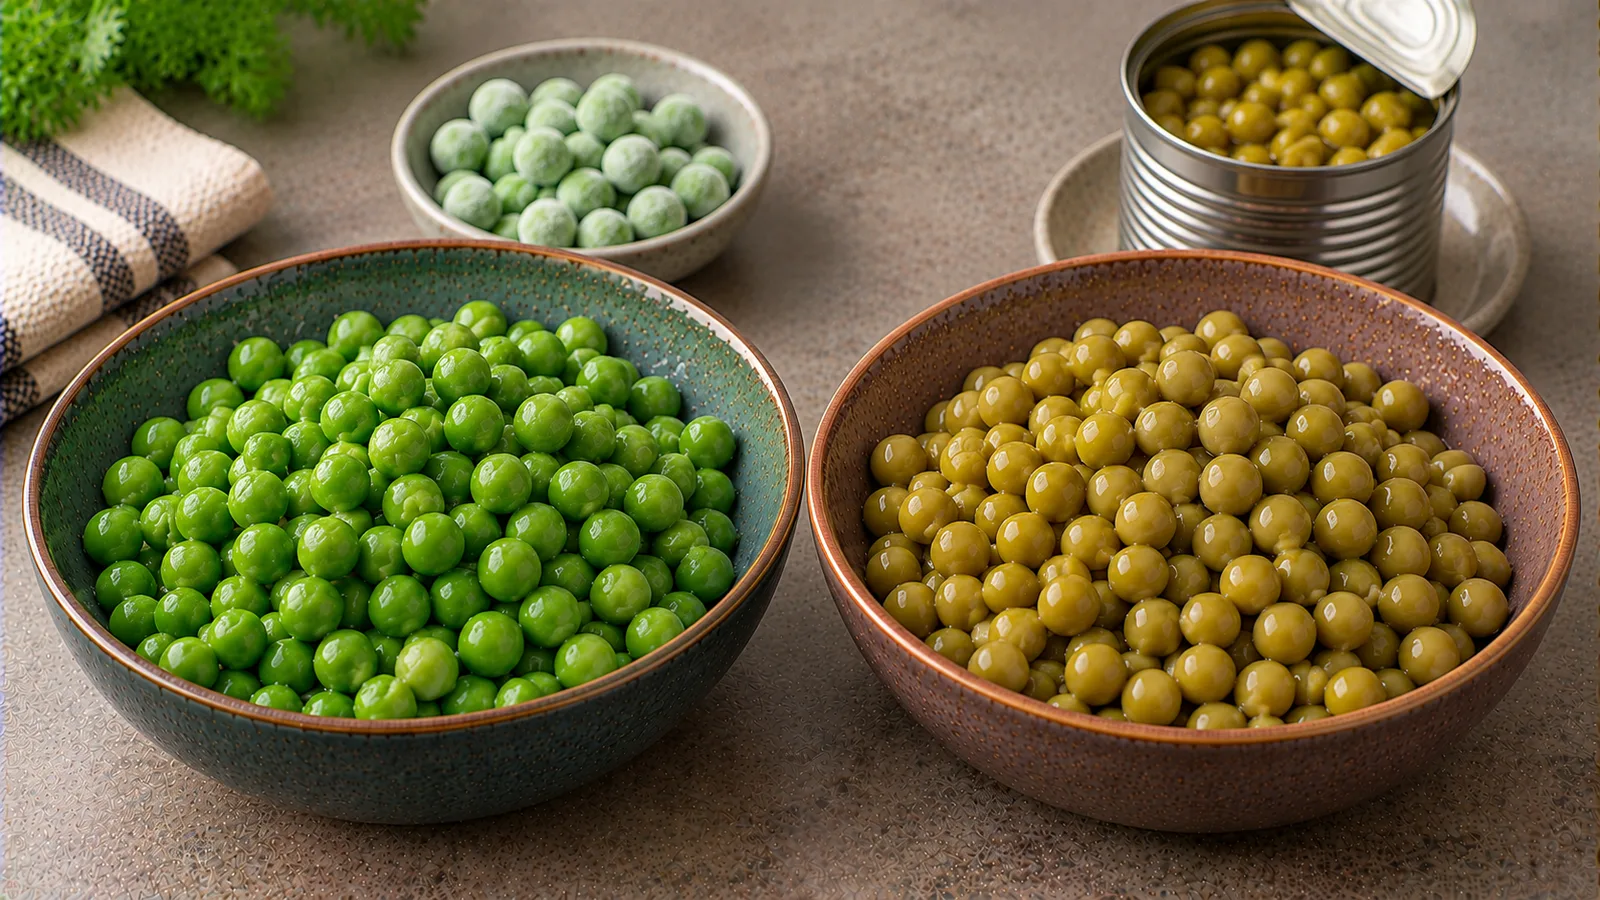
Cooked frozen peas and canned peas can differ in salt and total sugar; compare an actual 150 g serving and calculate prices using cooked or drained weight.
Read article →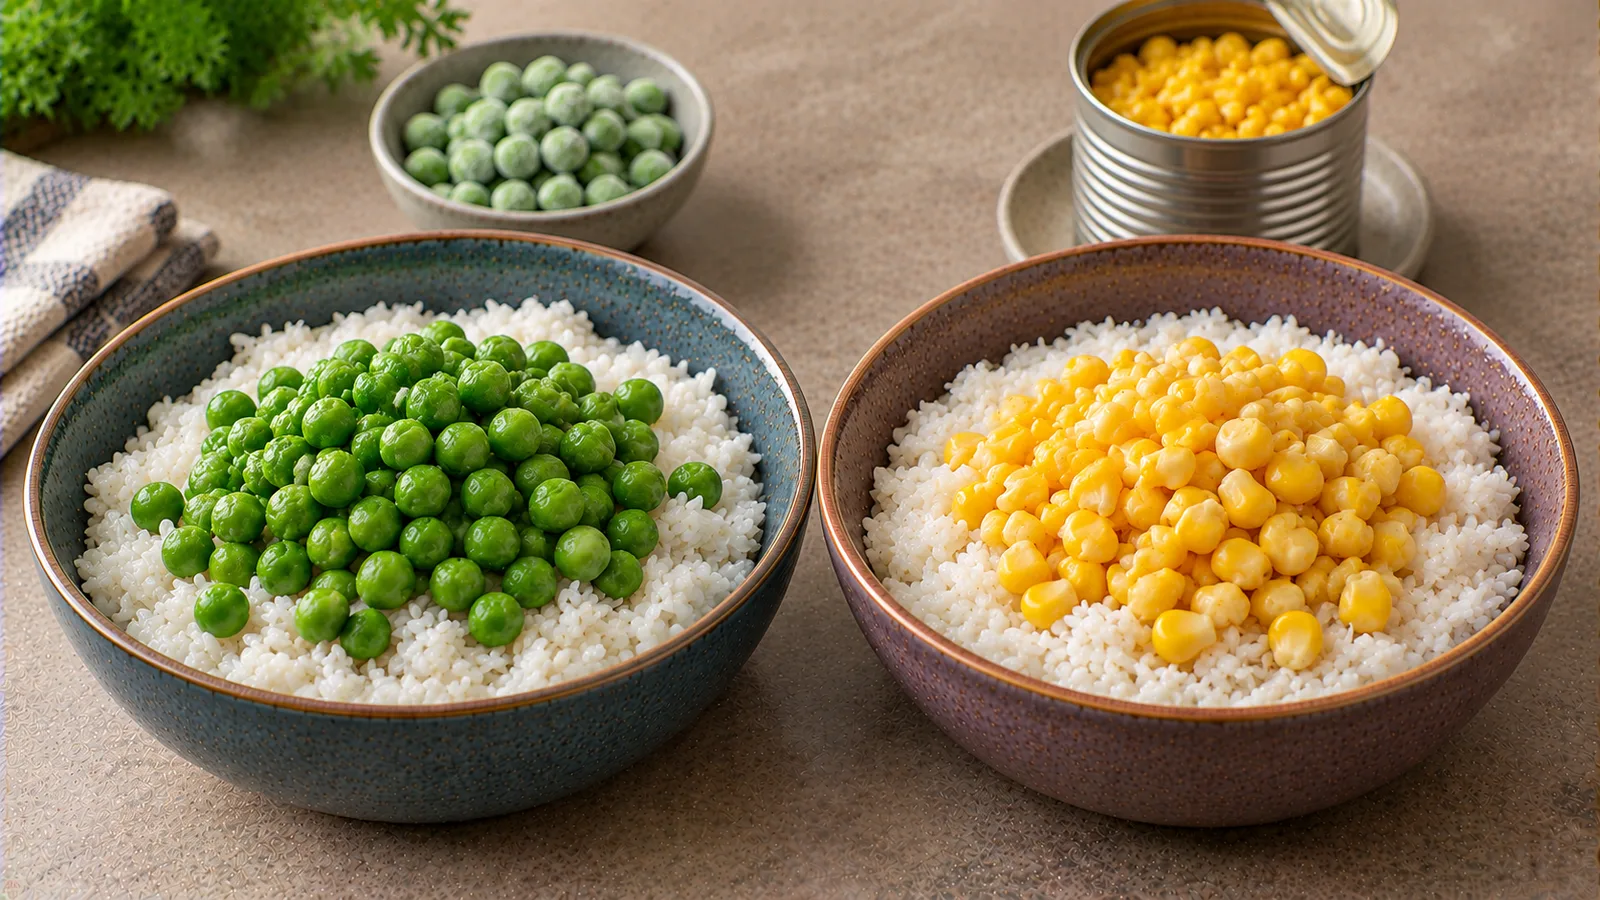
Per 100 g edible, cooked frozen peas have about 4.5 g fibre versus 2.4 g in the selected drained canned sweetcorn; pack prices need a cooked-yield adjustment.
Read article →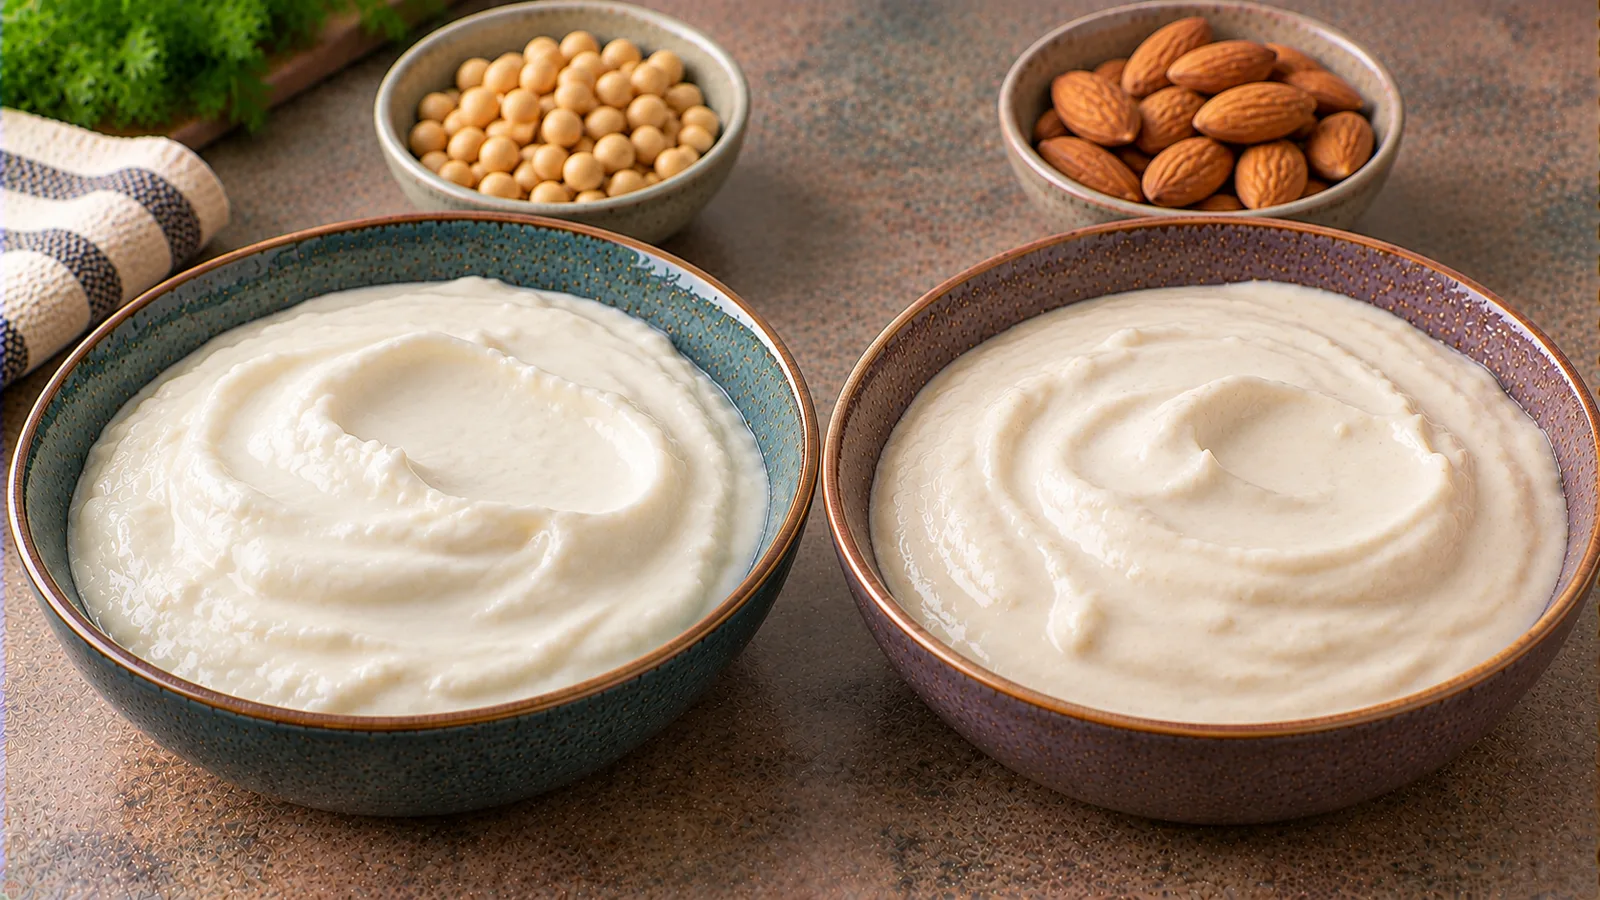
At 150 g, the chosen soy alternative provides 6 g protein and 180 mg declared calcium; the almond alternative gives 1.8 g protein but does not declare calcium.
Read article →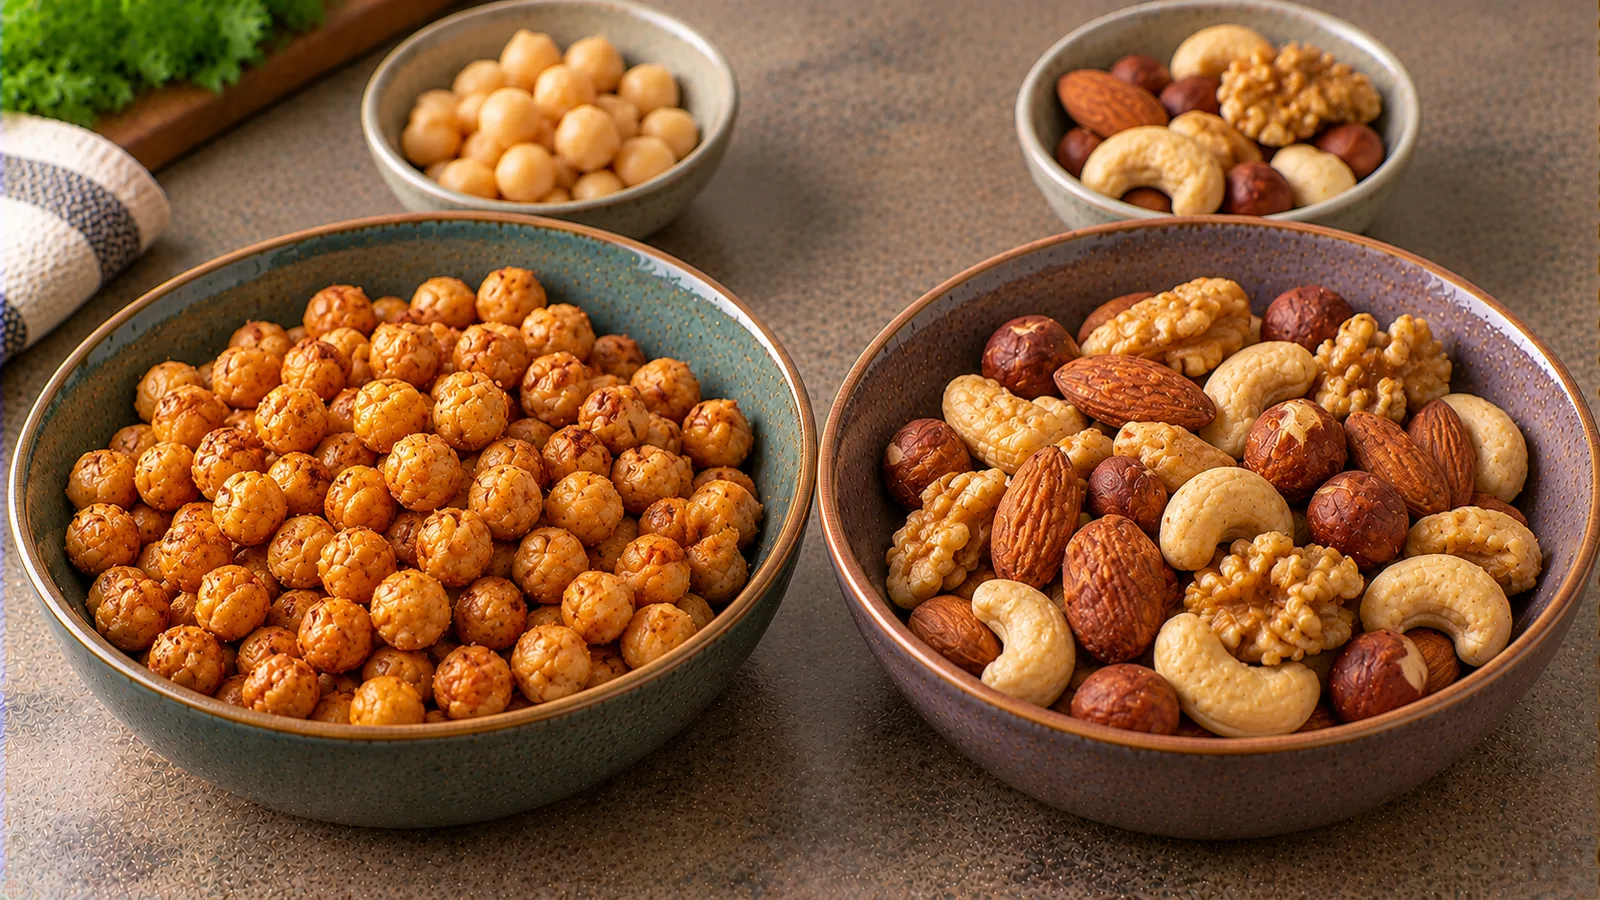
A ready-to-eat 30 g comparison of seasoned roasted chickpeas and unsalted mixed nuts, including price per serving.
Read article →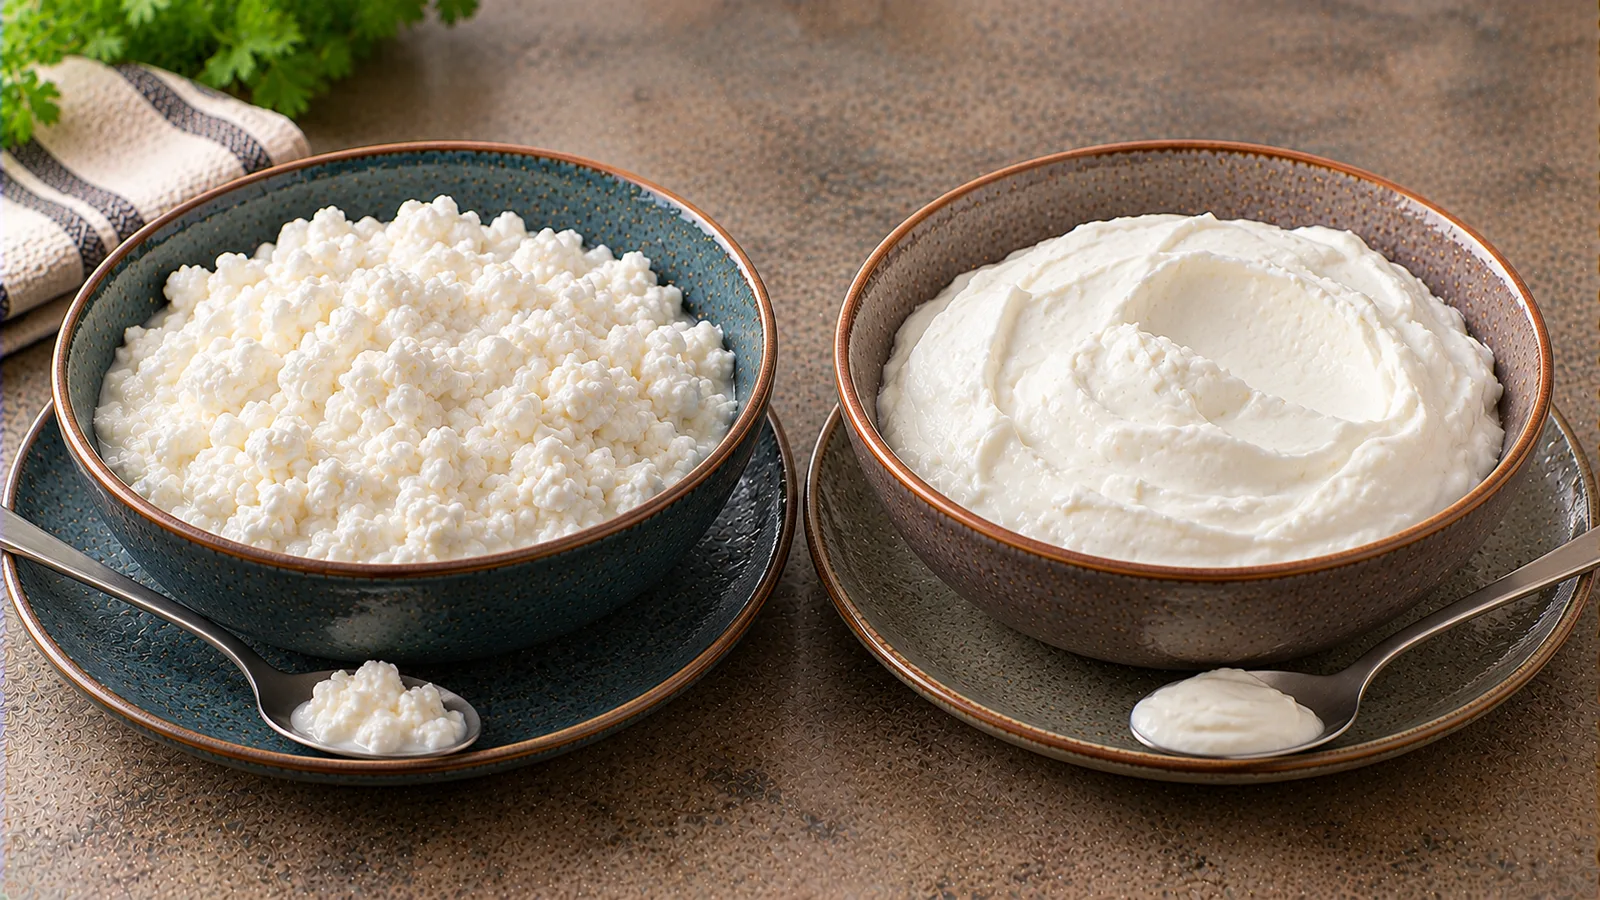
Two plain German dairy products compared at 150 g: close protein, very different salt and portion price.
Read article →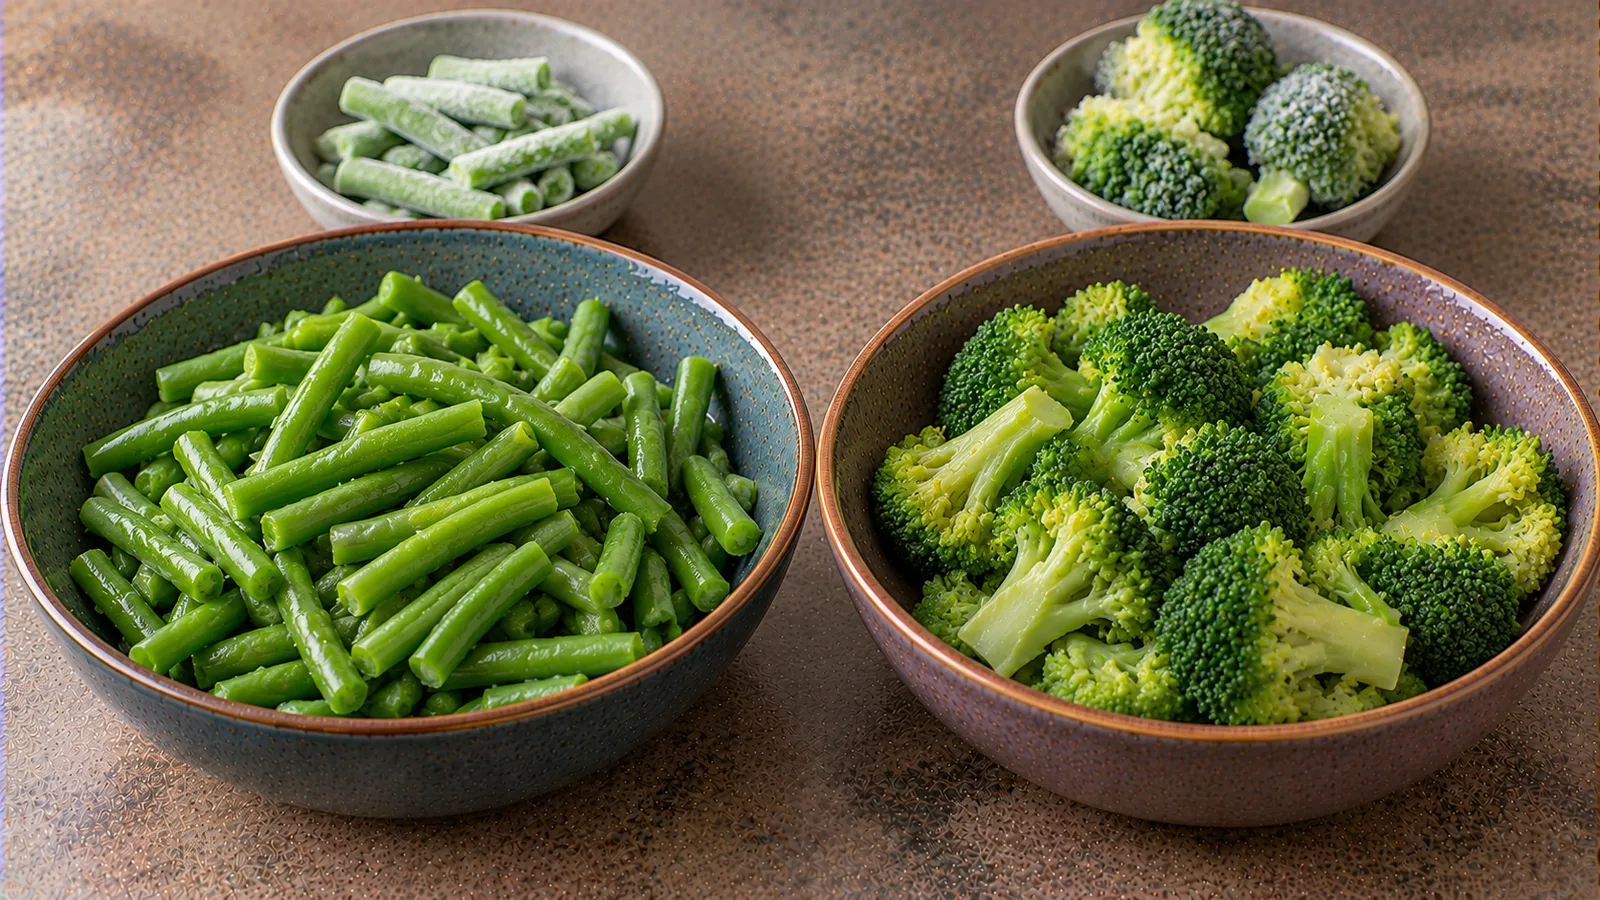
Cooked 150 g fiber is tied in USDA data. Compare Aldi Süd pack prices, yield-adjusted cost and green-bean cooking safety.
Read article →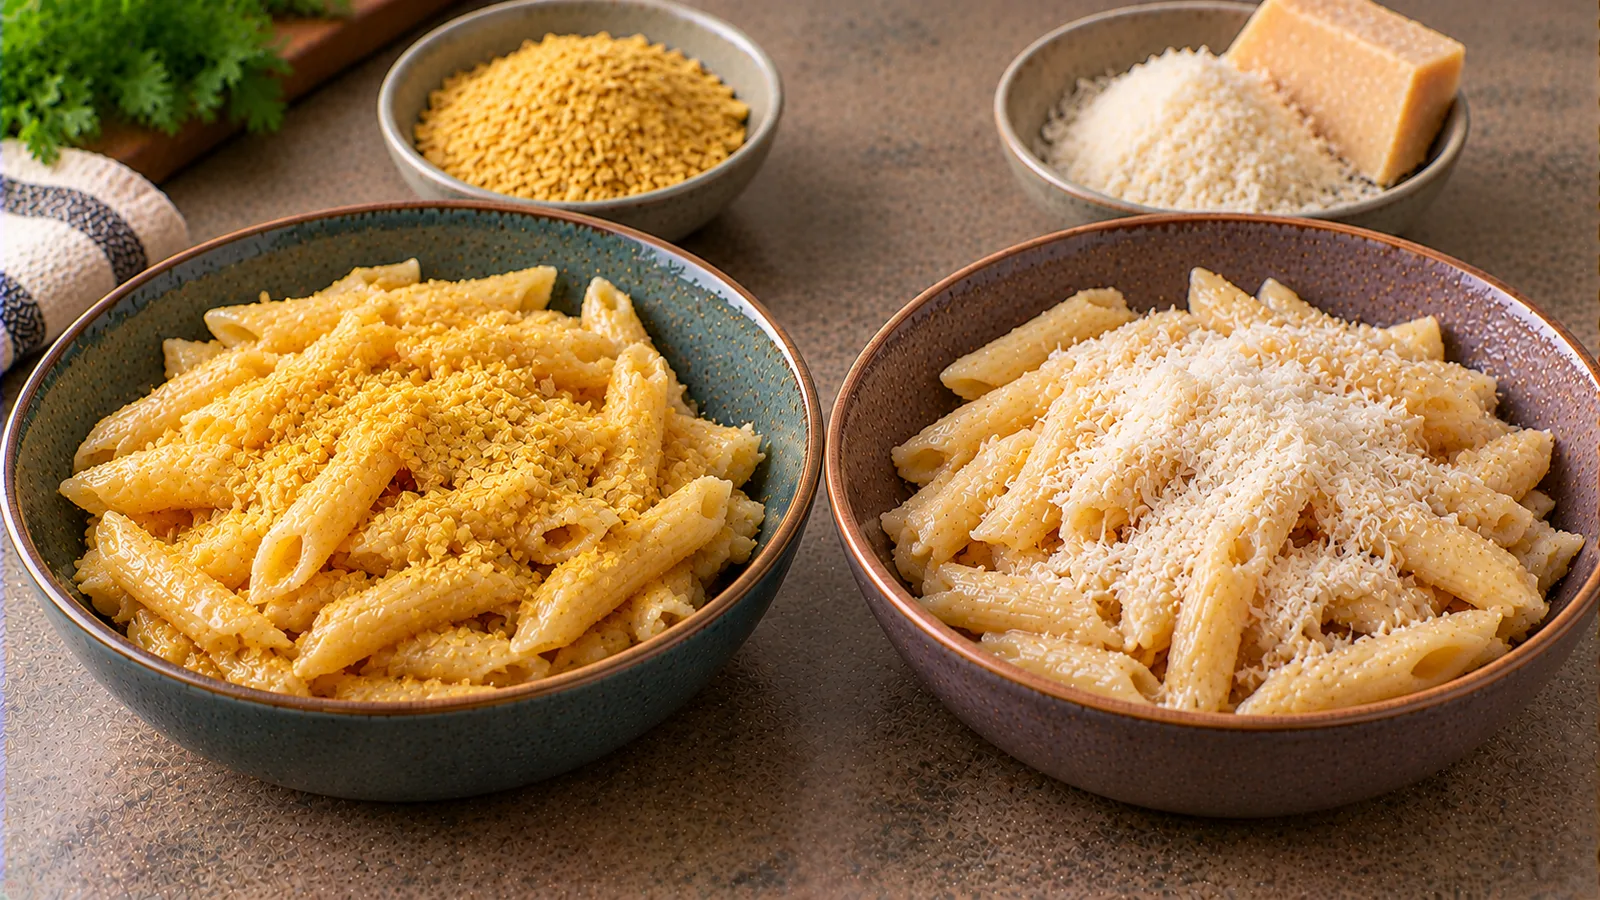
A matched 10 g topping comparison with real manufacturer values, a high-salt yeast counterexample, and practical label-reading steps.
Read article →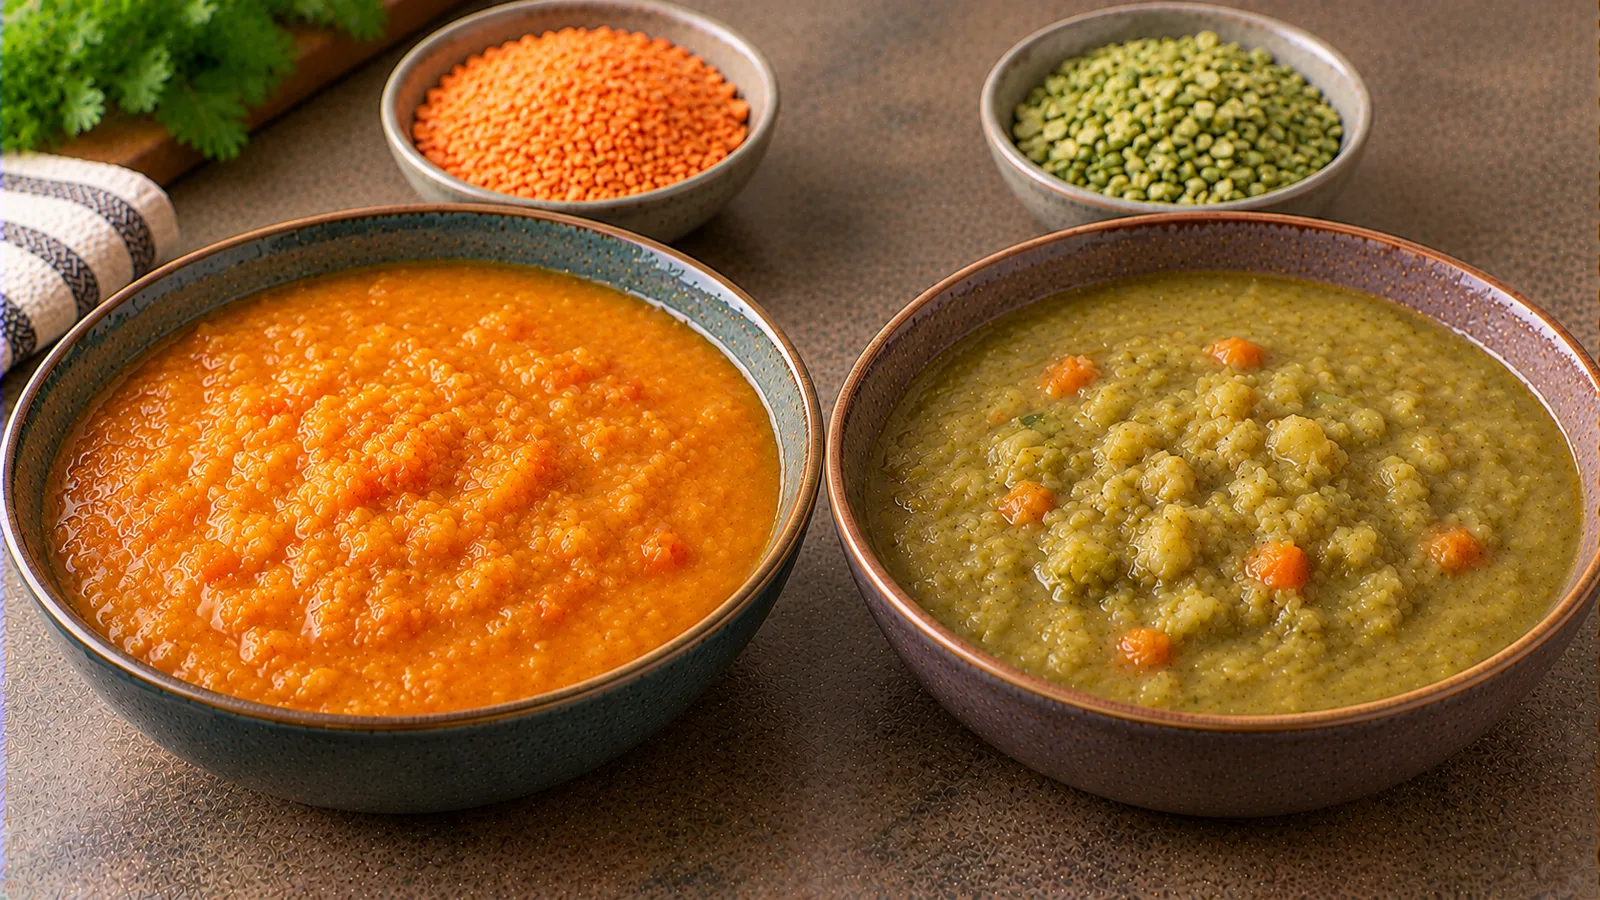
Which pulse makes a quicker, cheaper soup? A matched-bowl dry-weight calculation, specific store listings, real cooking instructions and leftovers guidance.
Read article →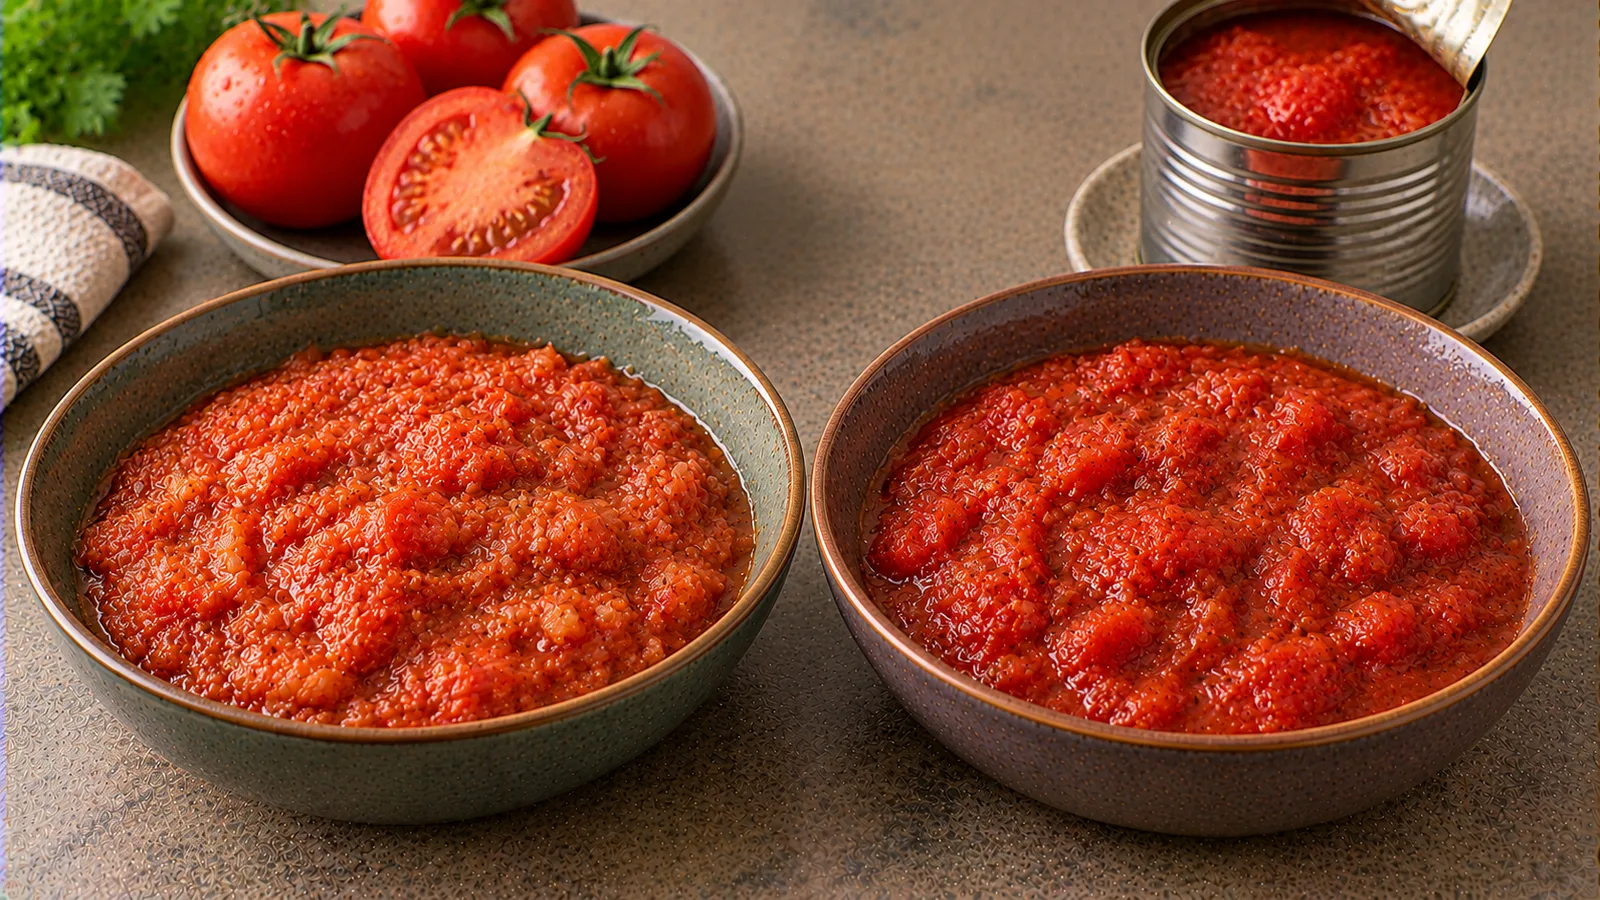
A practical finished-sauce cost comparison that separates fresh-tomato trimming, canned net weight, reduction and price per serving.
Read article →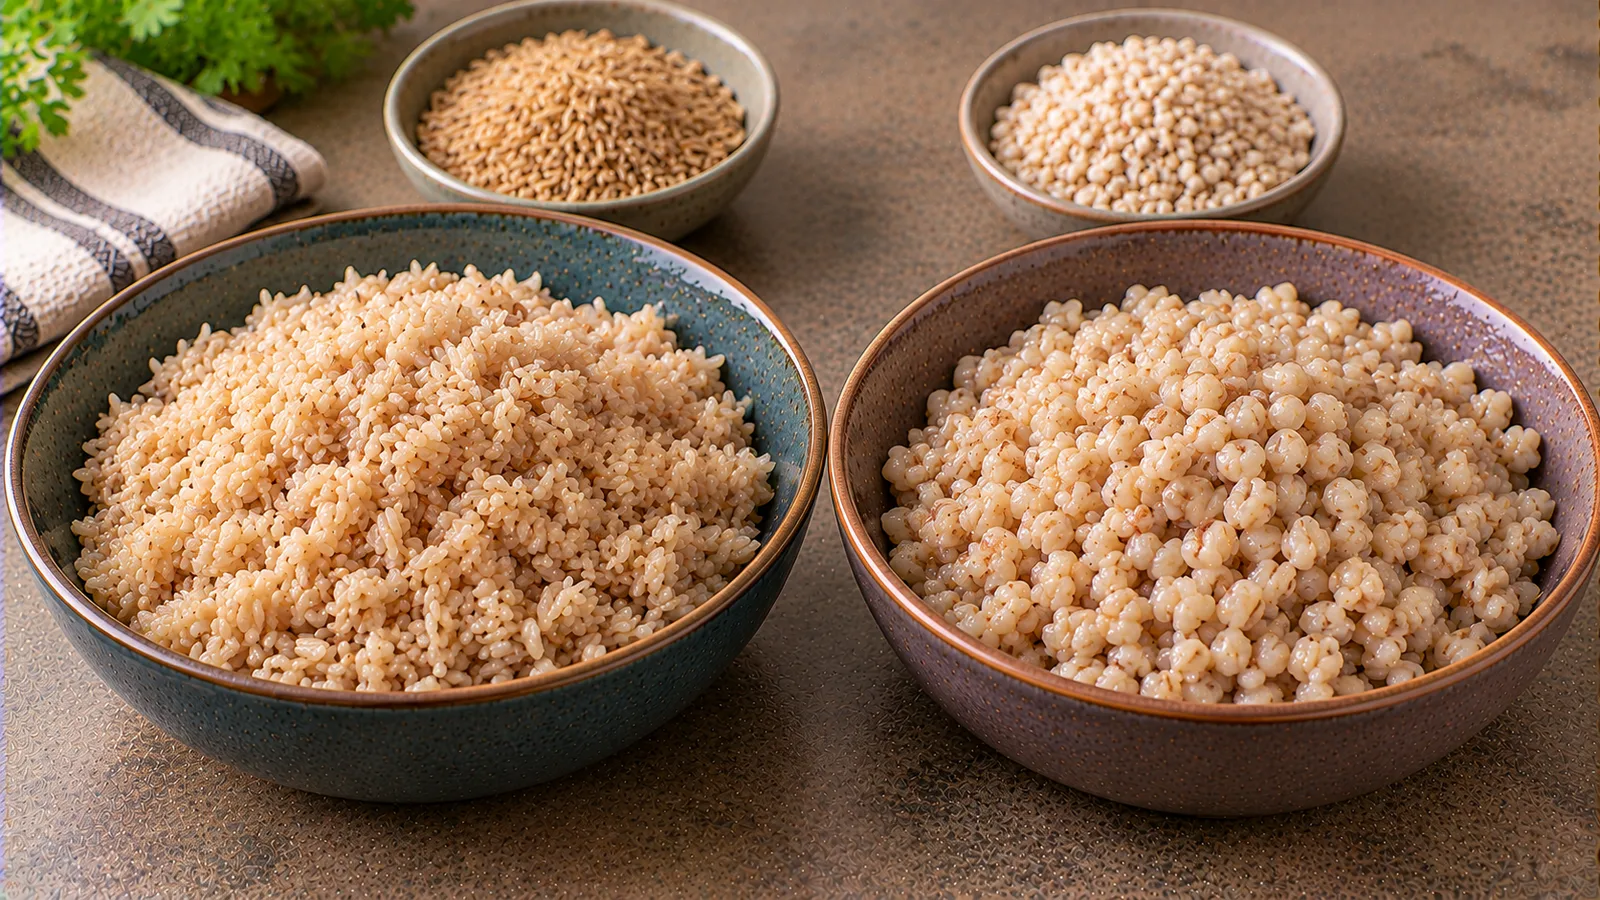
A like-for-like cooked-weight comparison: brown rice has 2.4 g fibre and pearl barley 5.7 g per 150 g, but only rice is naturally gluten-free.
Read article →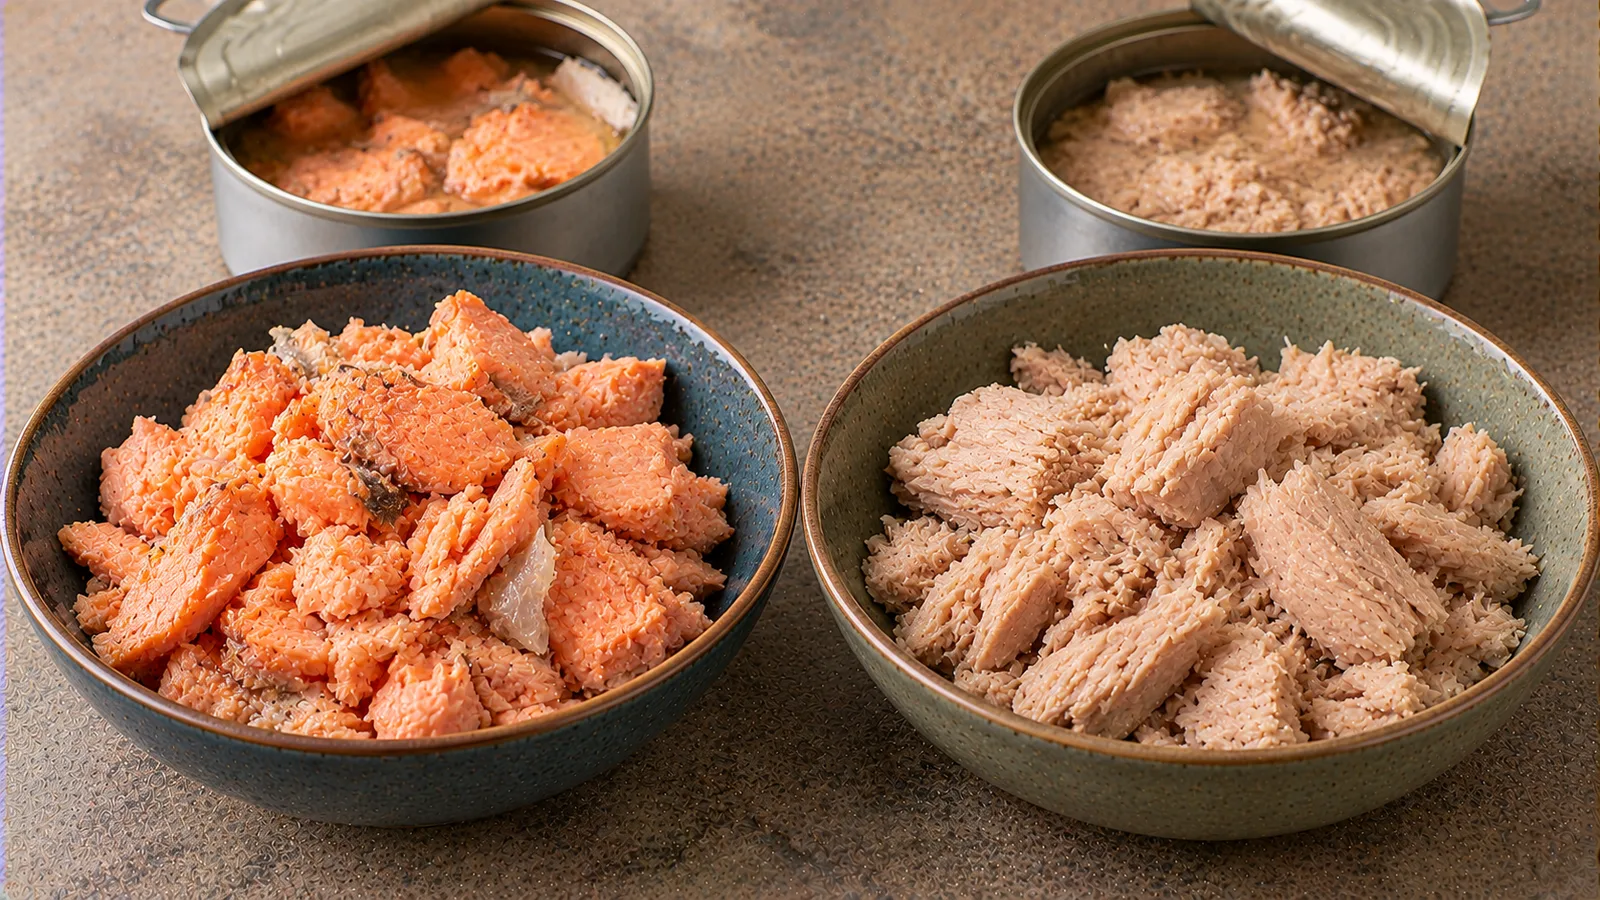
A fair 100 g drained-weight comparison of canned salmon and tuna: protein, calcium with edible bones, mercury categories and a dated cost example.
Read article →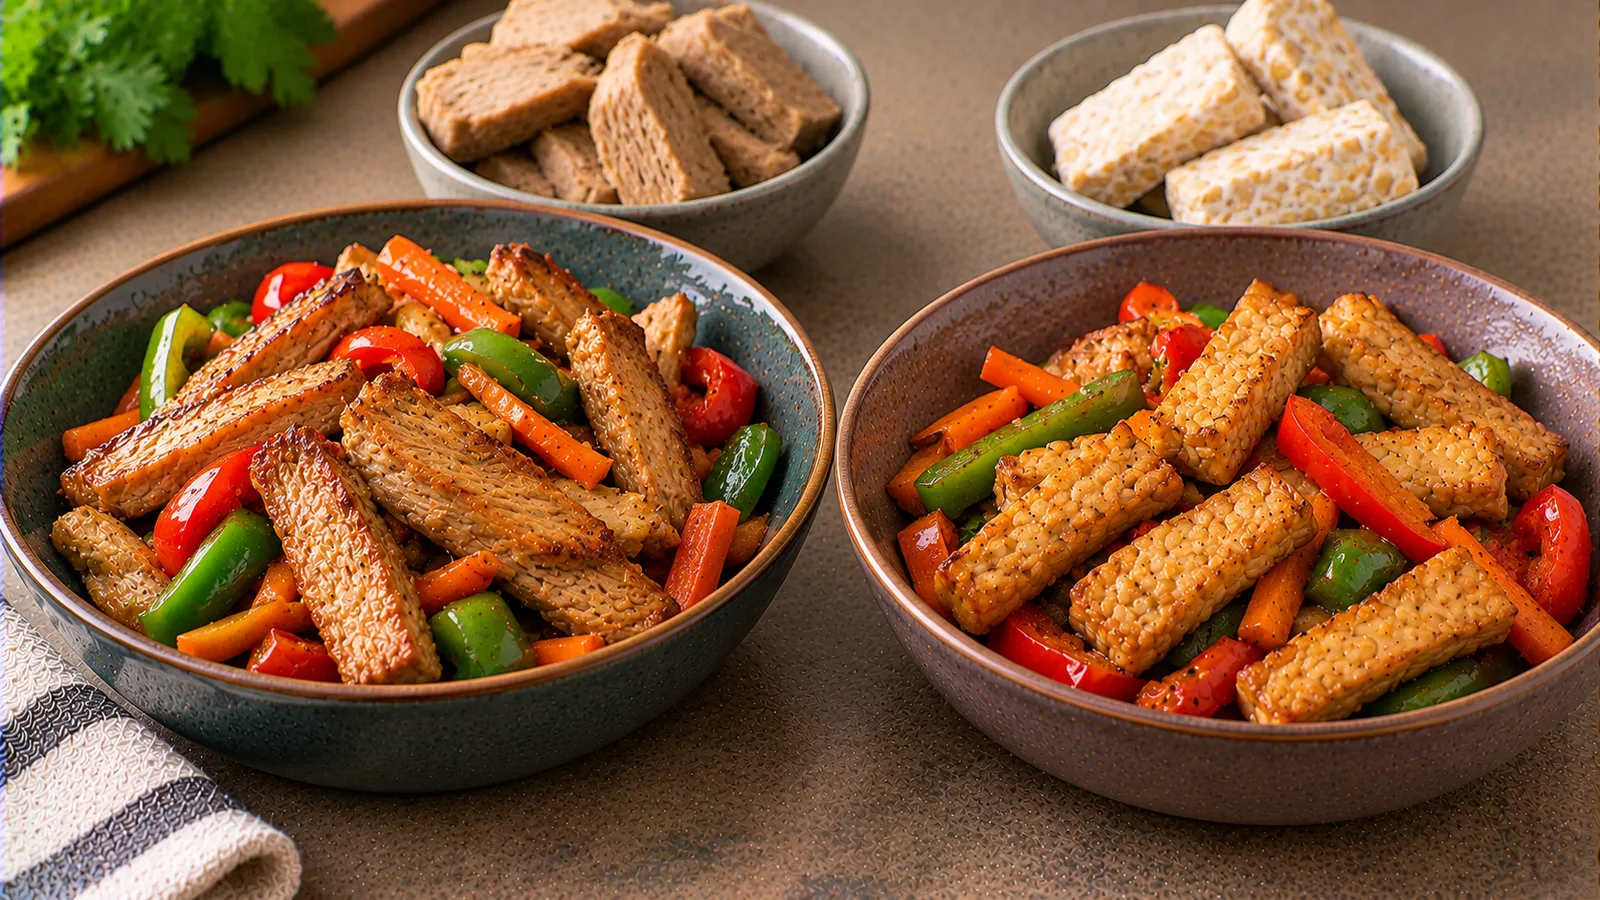
An equal-150-g comparison of two named ready-to-cook seitan and tempeh products, including salt, protein, allergens, and portion price.
Read article →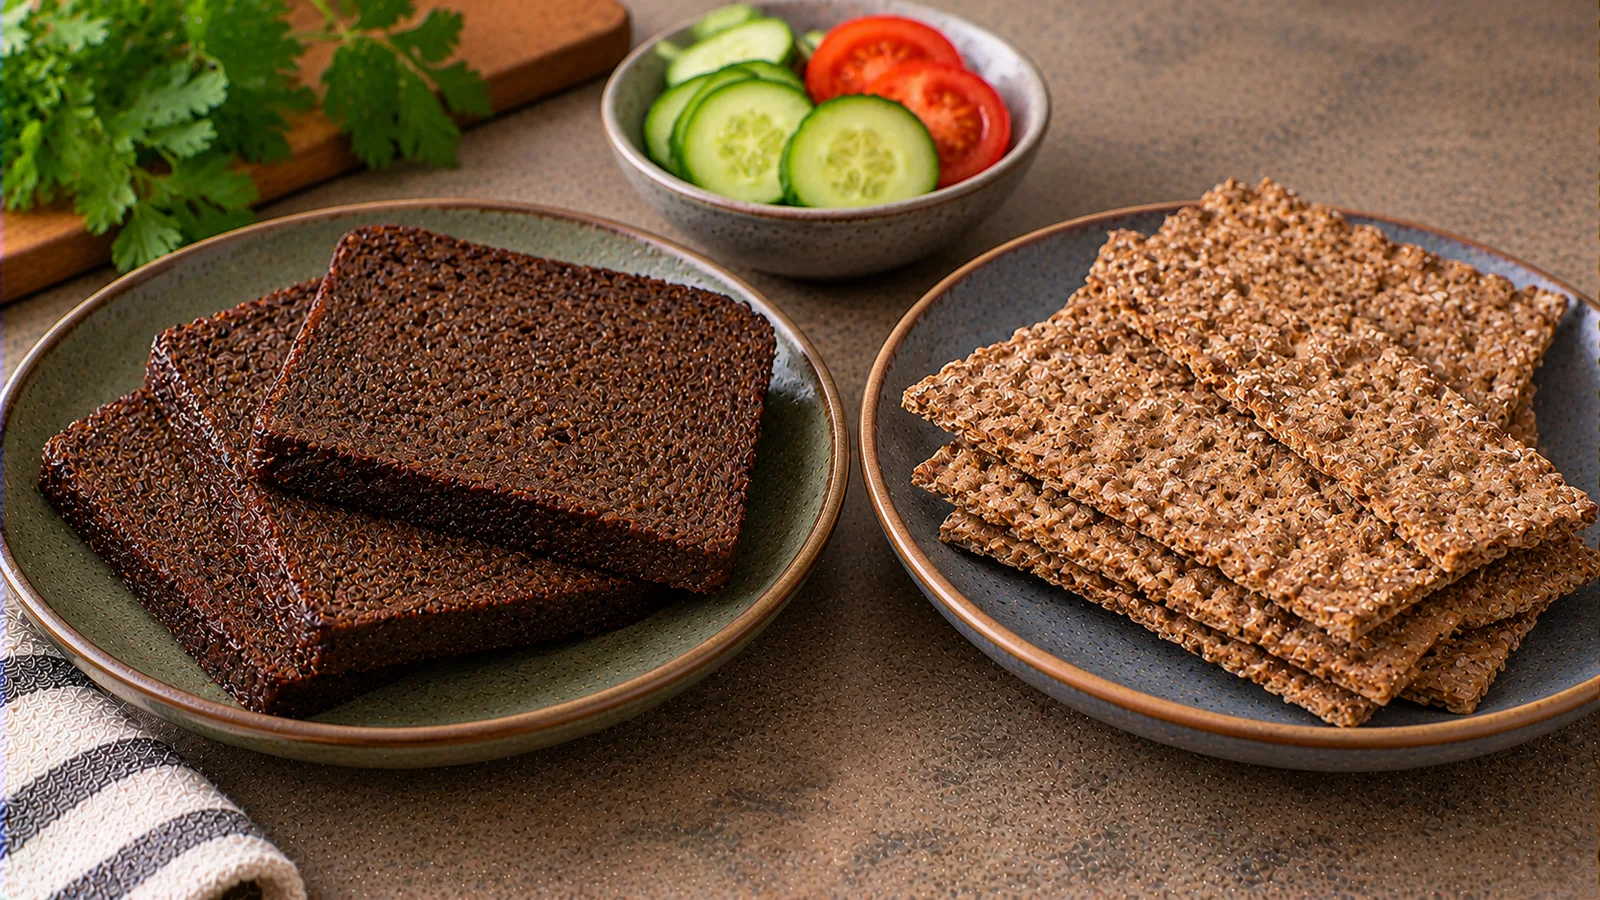
A product-specific 50 g comparison of pumpernickel and rye crispbread, including labelled nutrients and an explained price calculation.
Read article →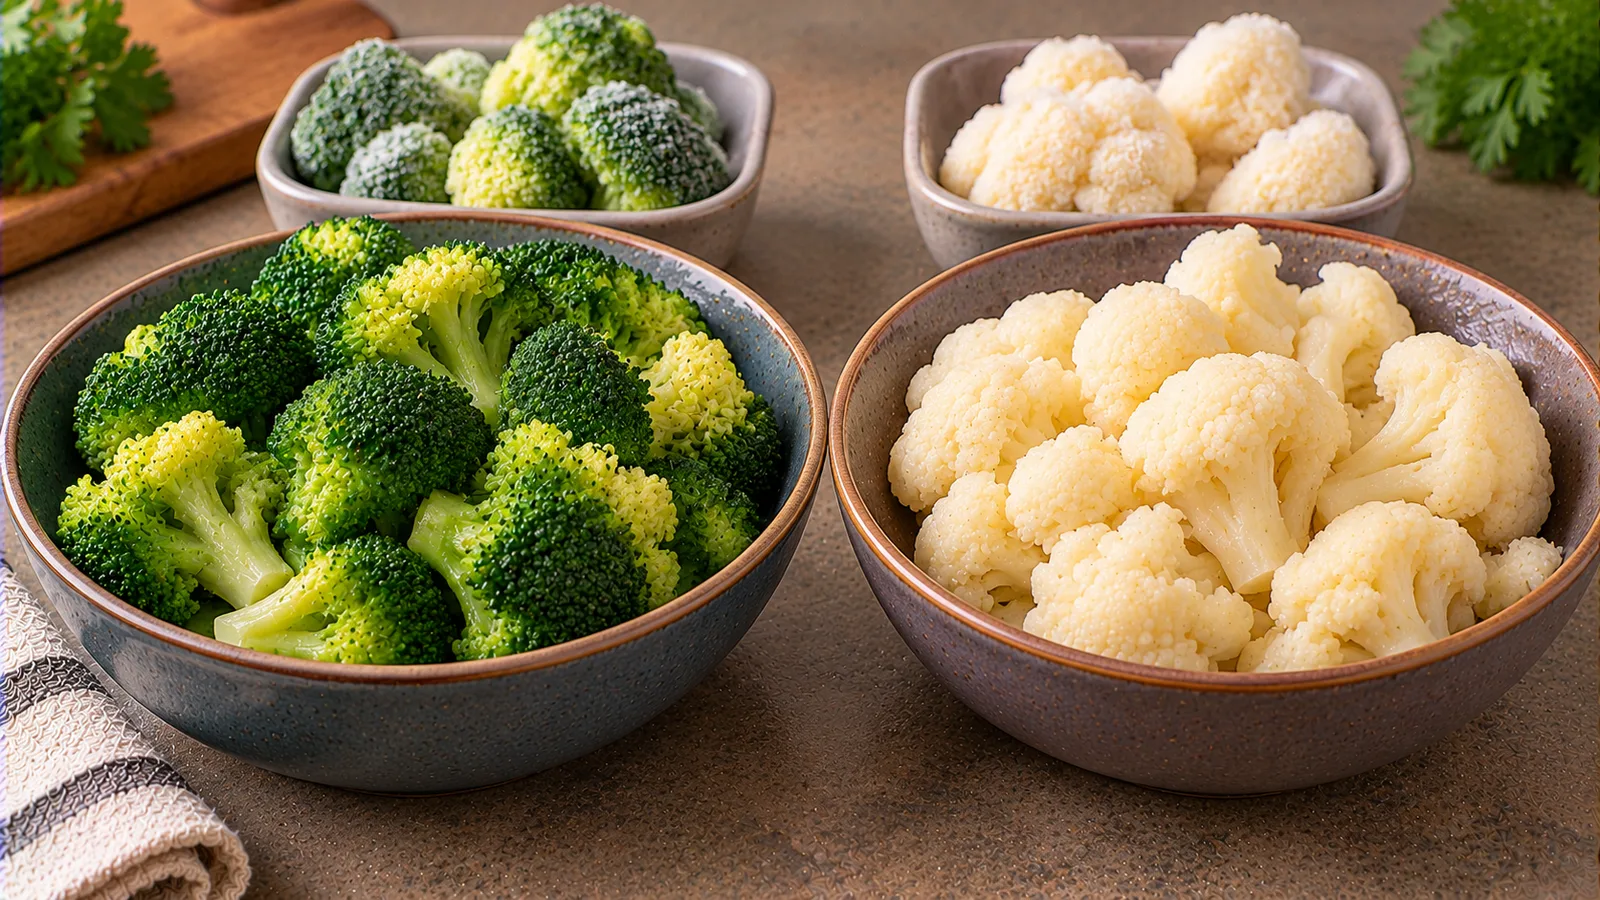
A measured cooked-portion comparison with BLS reference fiber values and traceable, clearly qualified 1 kg supermarket price examples.
Read article →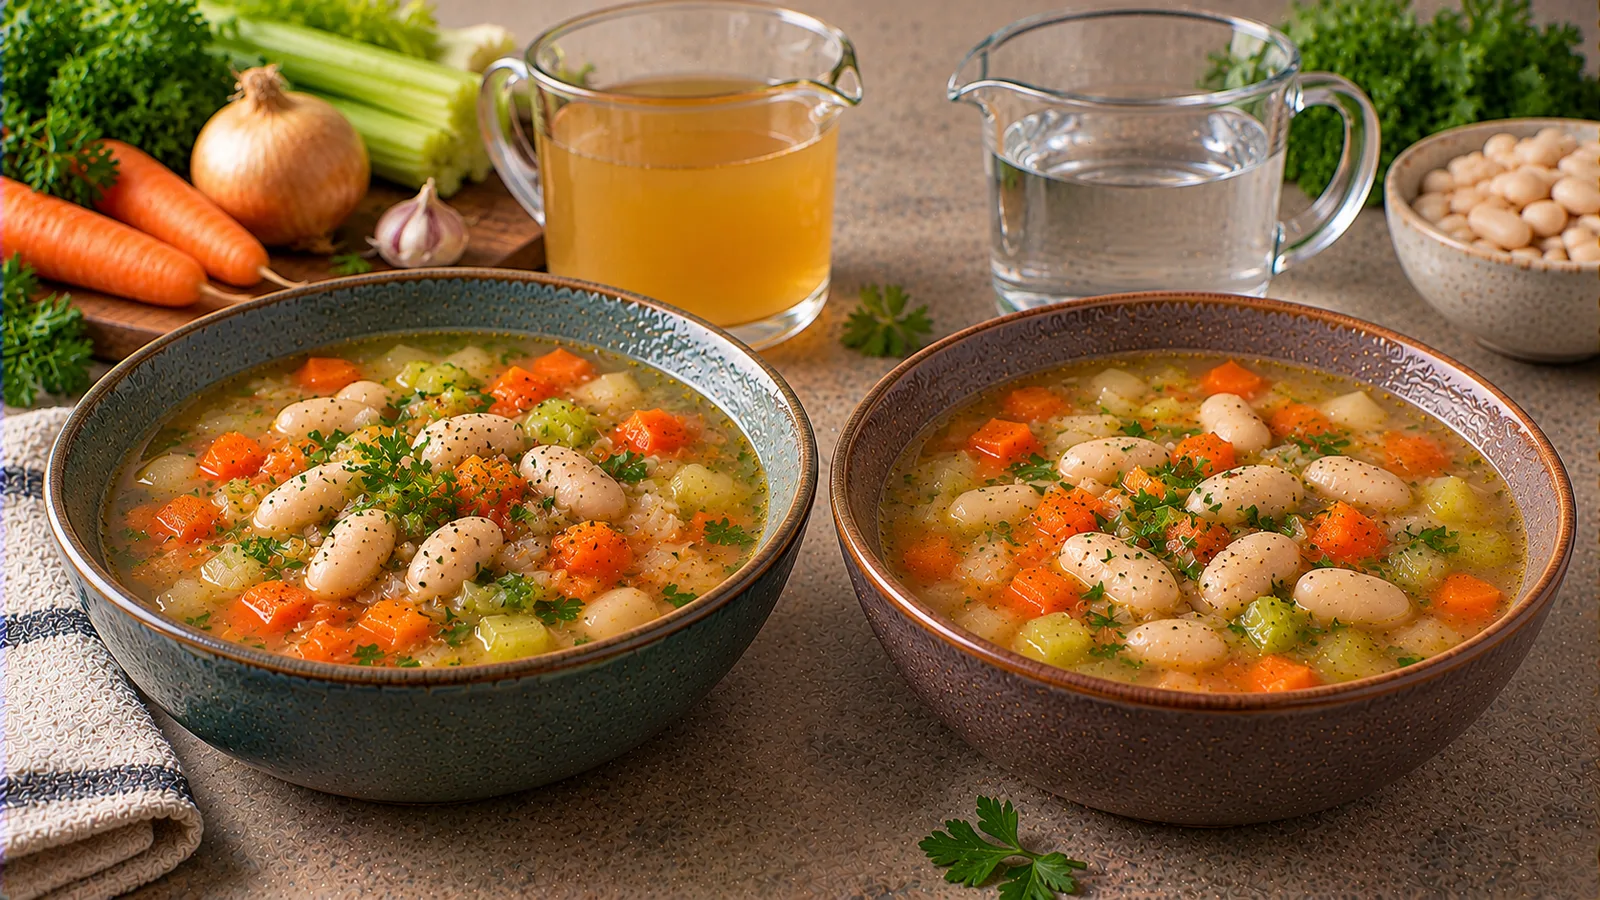
Calculate how water, half stock, or reduced-salt vegetable stock changes salt and sodium in four identical bean-soup bowls, using one verified prepared-stock label.
Read article →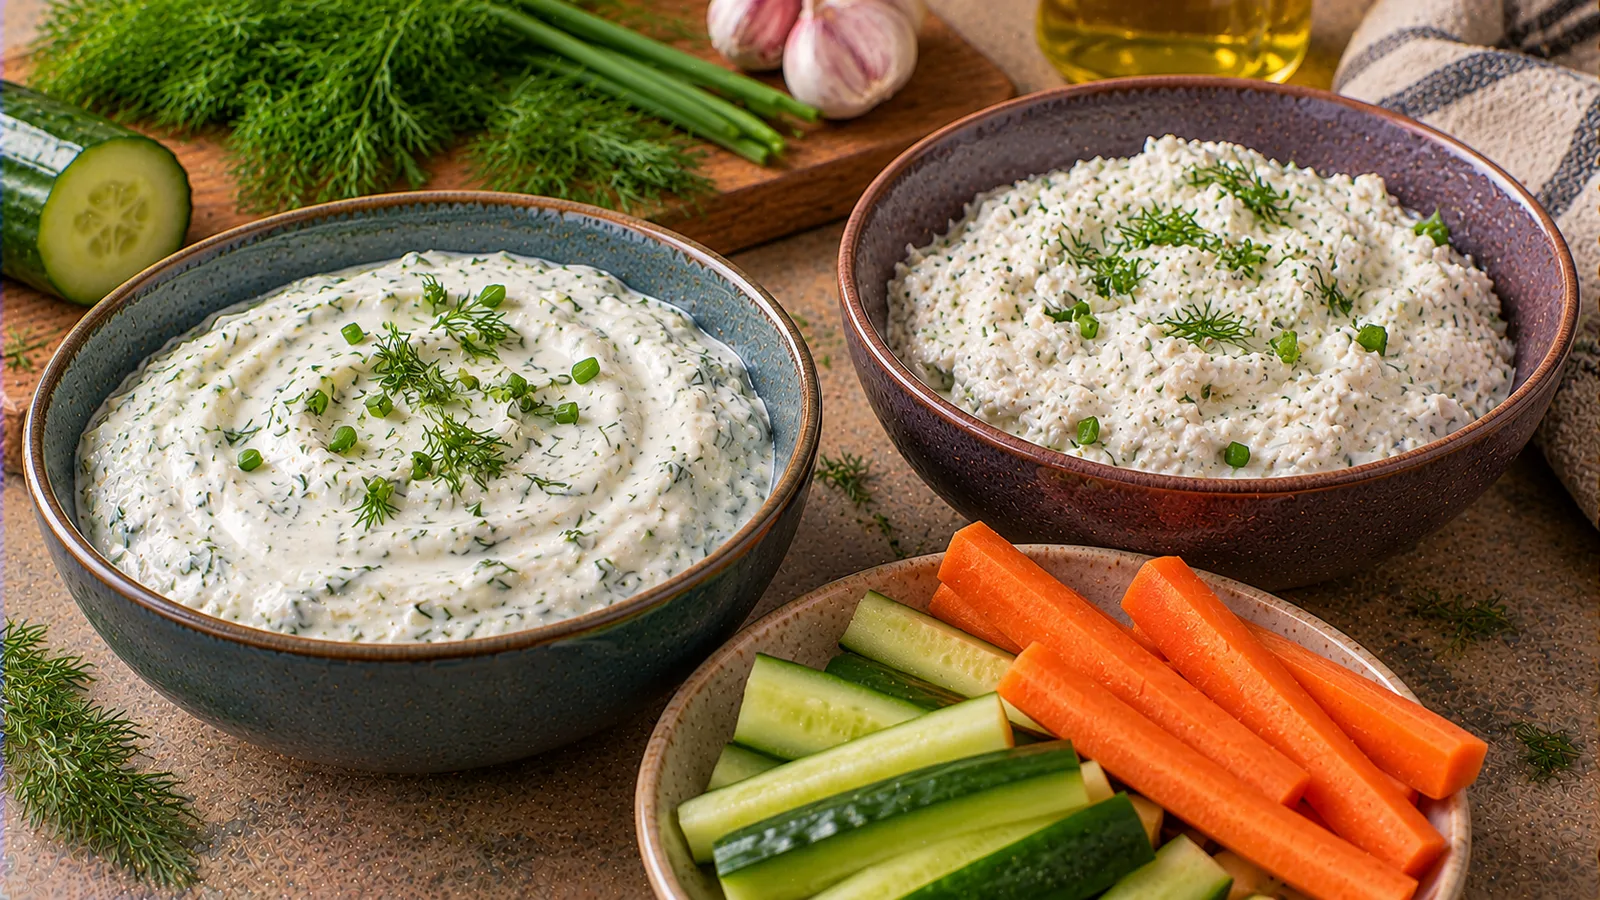
Compare two matched 284 g savory-dip bowls using Greek yogurt or low-fat quark: label protein, saturated fat, portions and illustrative ingredient versus checkout cost.
Read article →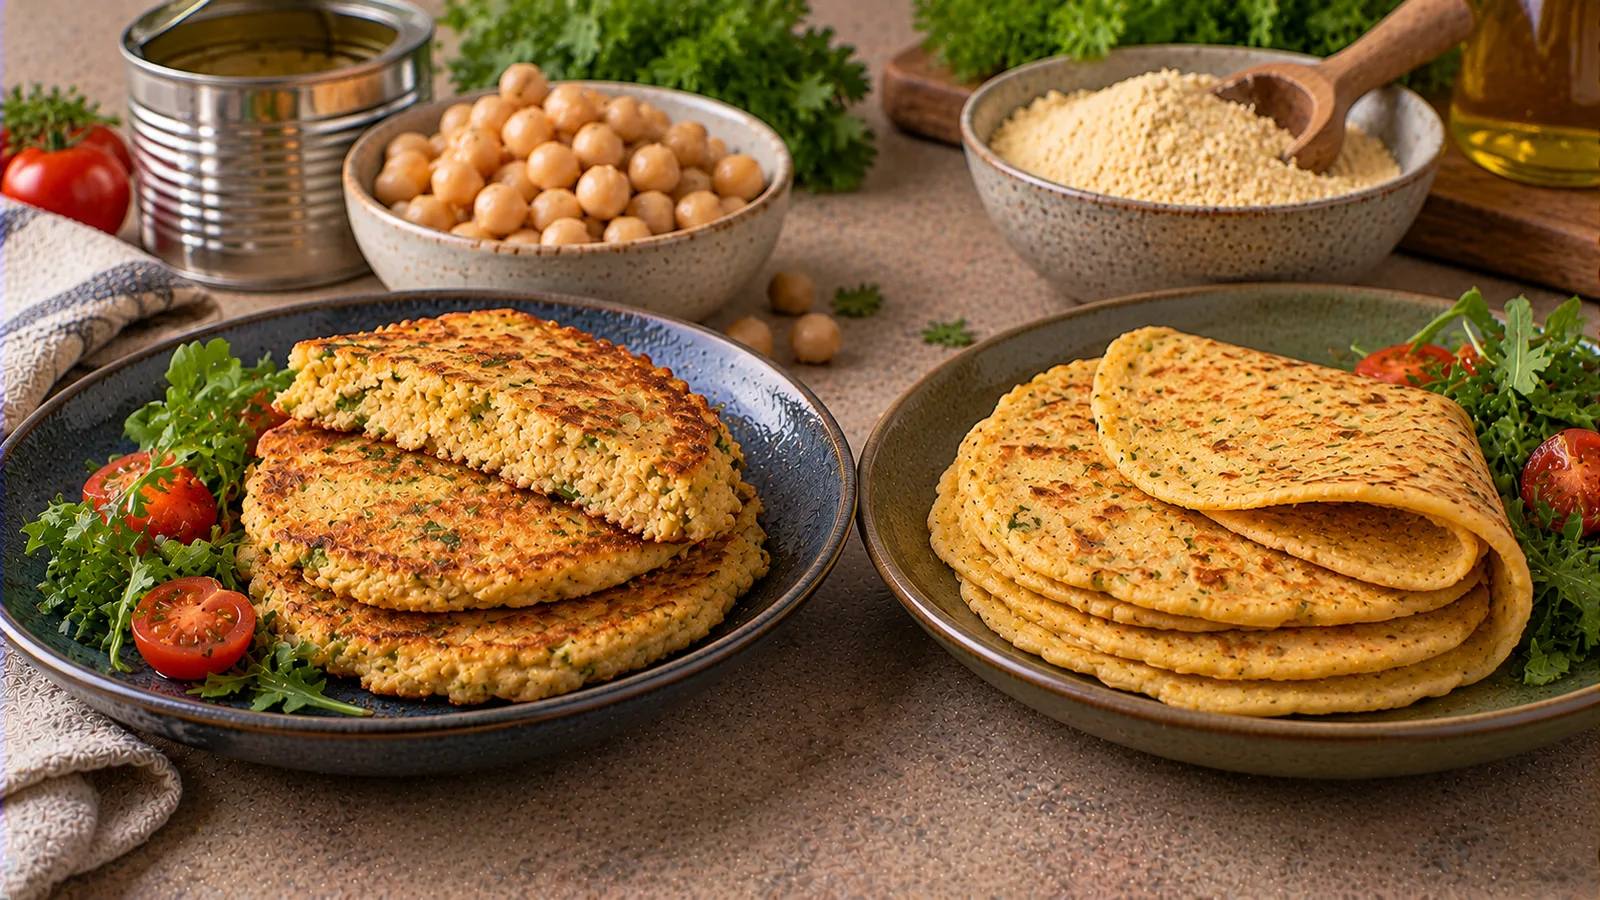
Compare two savory chickpea pancake methods with drained and dry ingredient weights, a cost-per-pancake model, cooked yield and label-based protein figures.
Read article →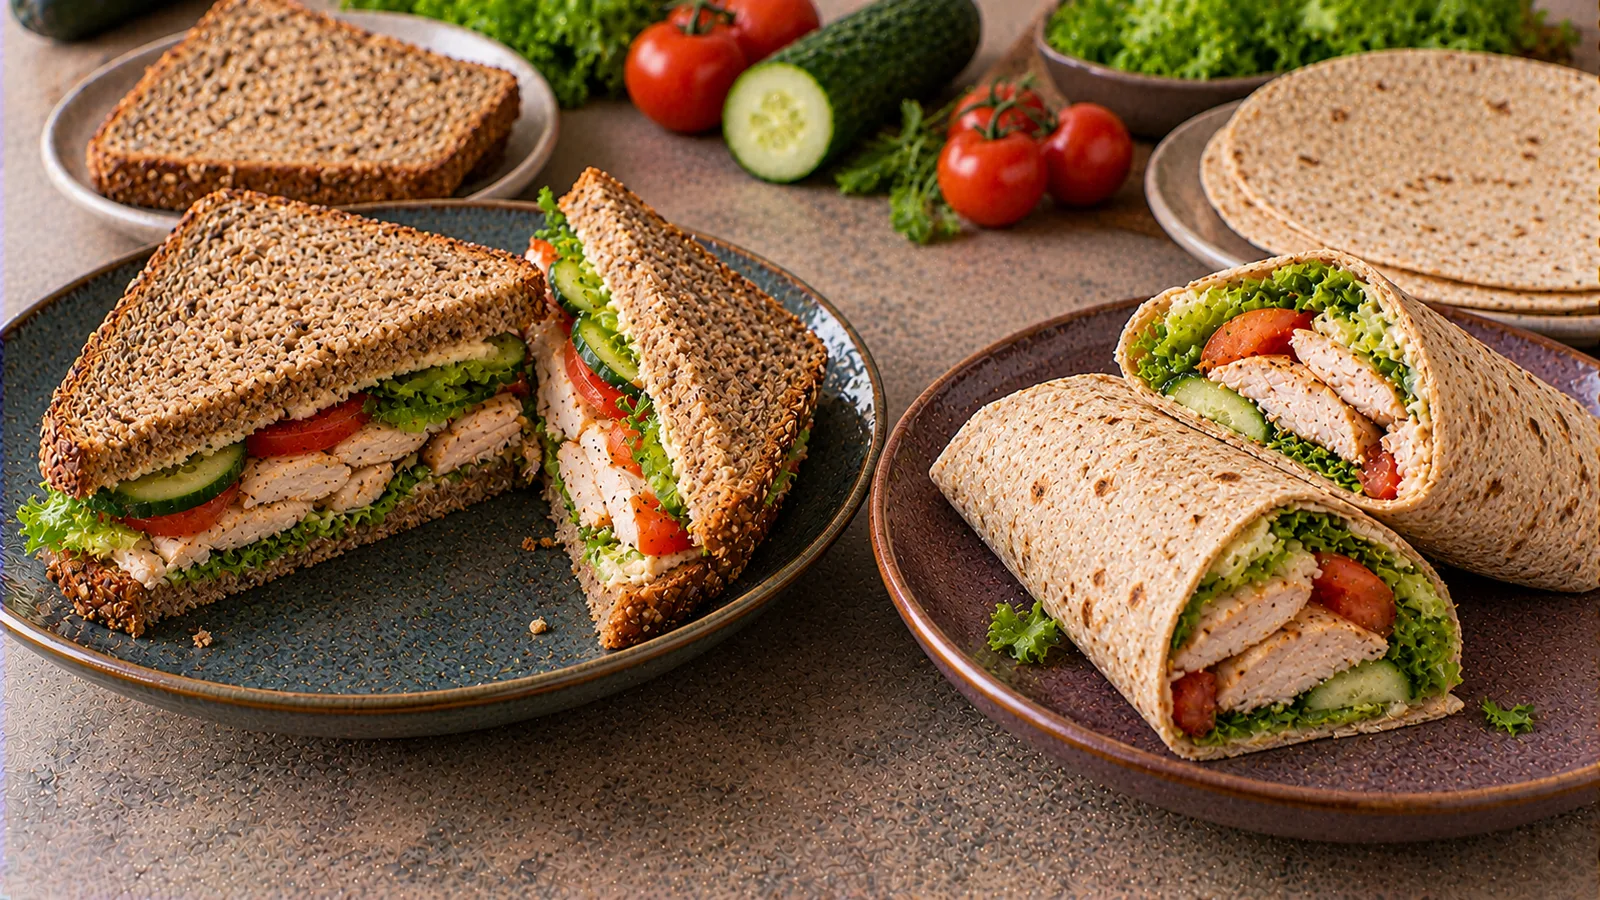
Compare the fiber, salt and ingredient cost of wholegrain bread and fiber-rich wraps at equal weight and realistic lunch portions, using real labels.
Read article →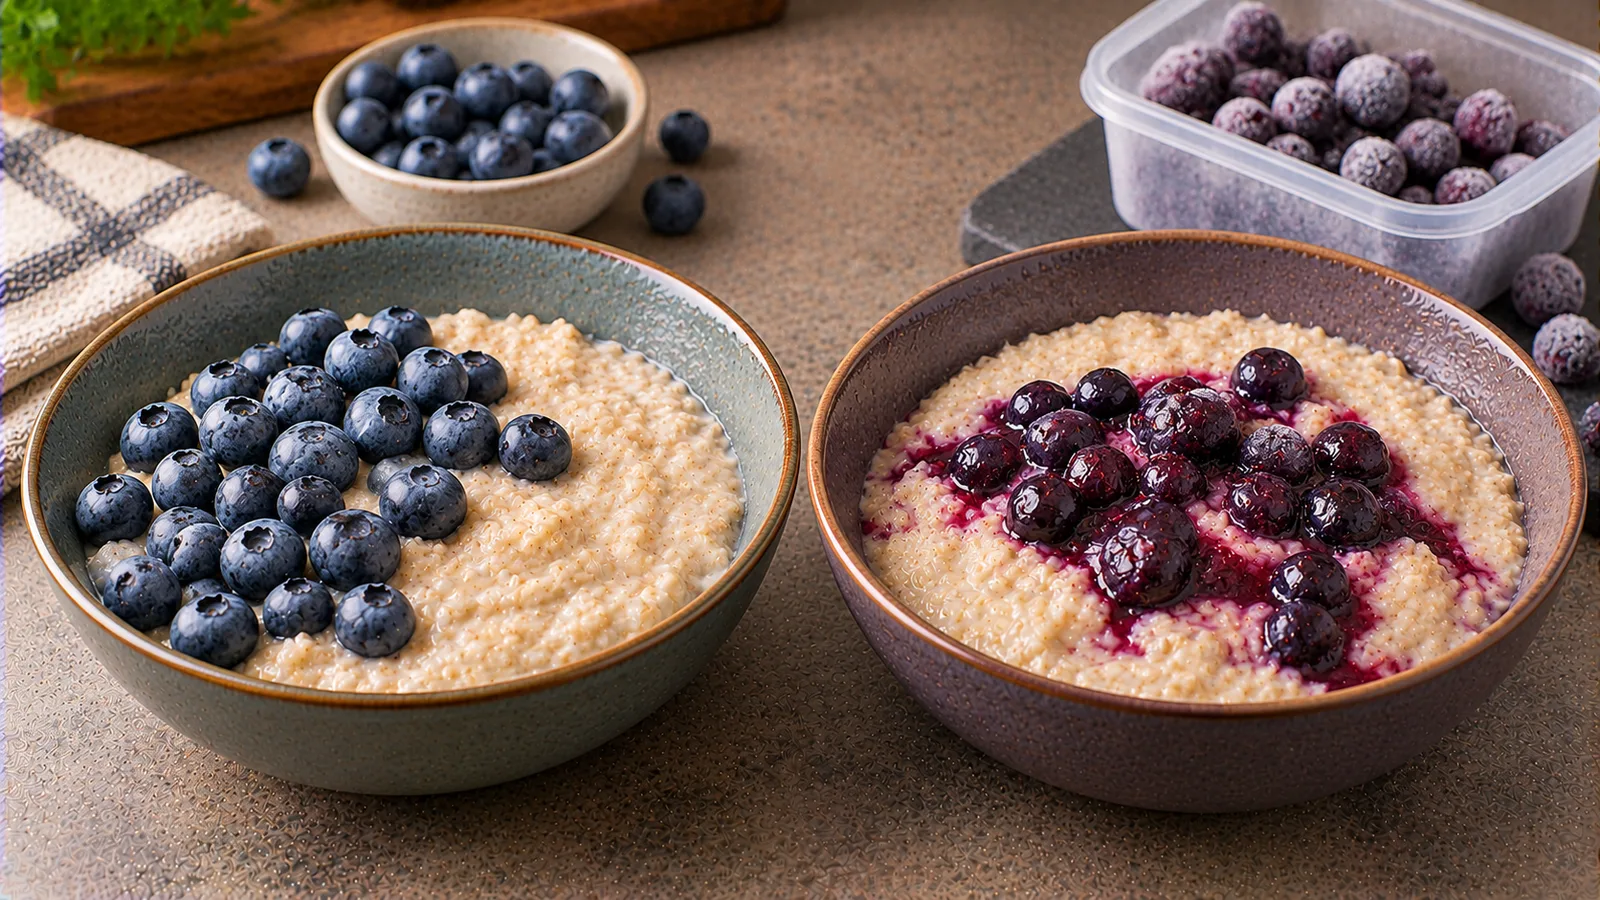
Compare fresh and frozen blueberries for one porridge bowl using usable weight, package price, losses and safe heating; see full worked examples.
Read article →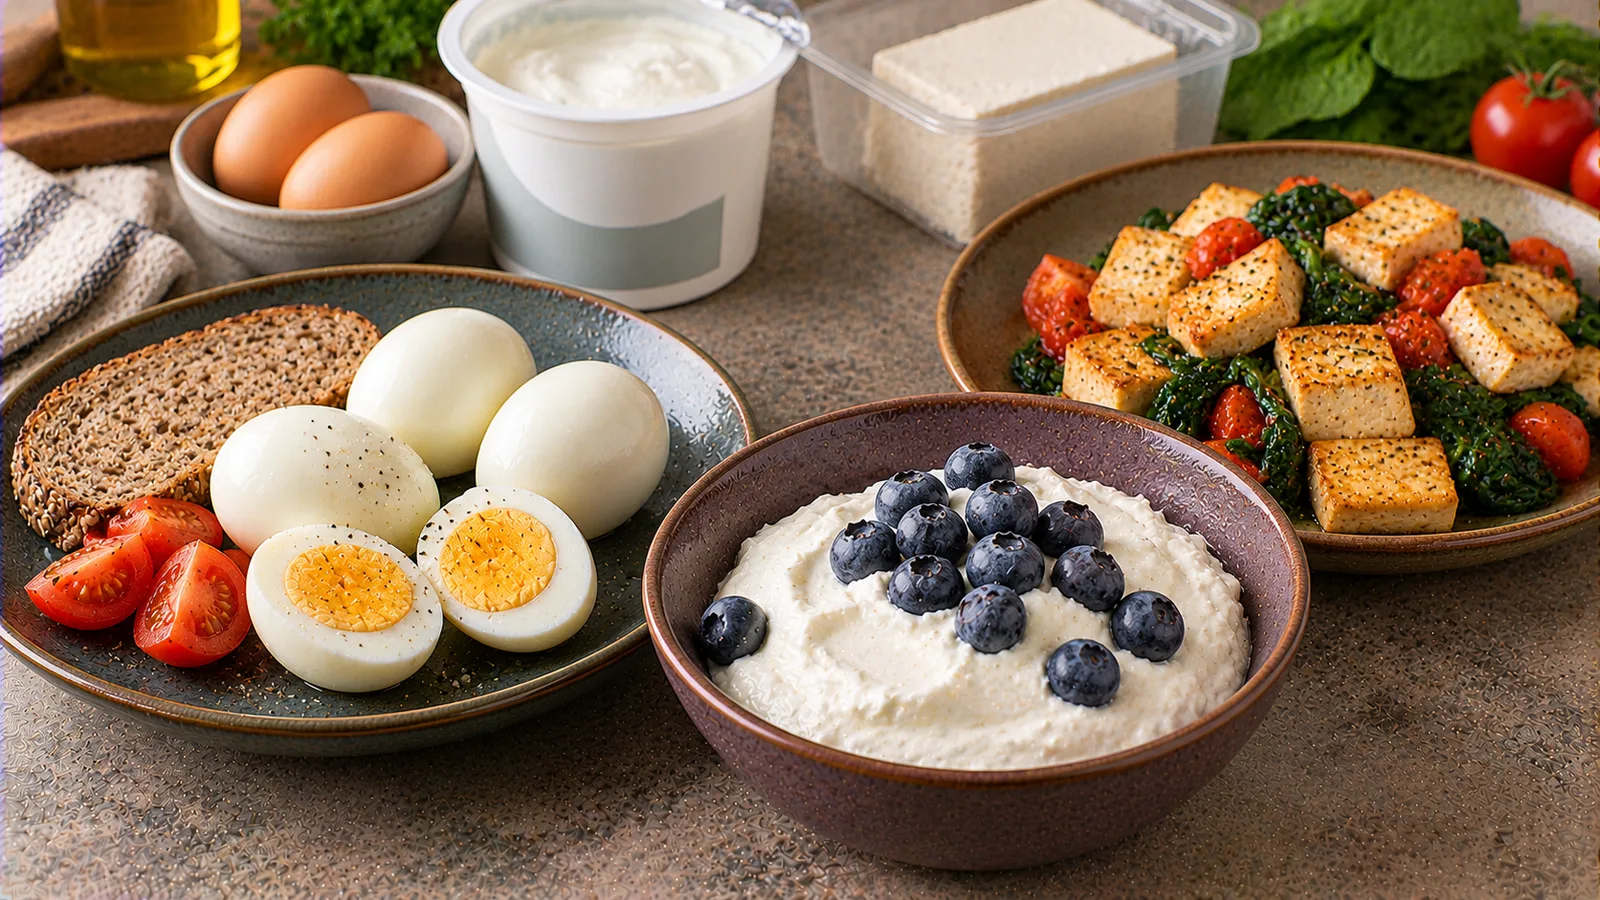
Compare eggs, plain skyr and firm tofu at breakfast using matched 20 g protein portions, illustrative German pack prices and what you really pay at checkout.
Read article →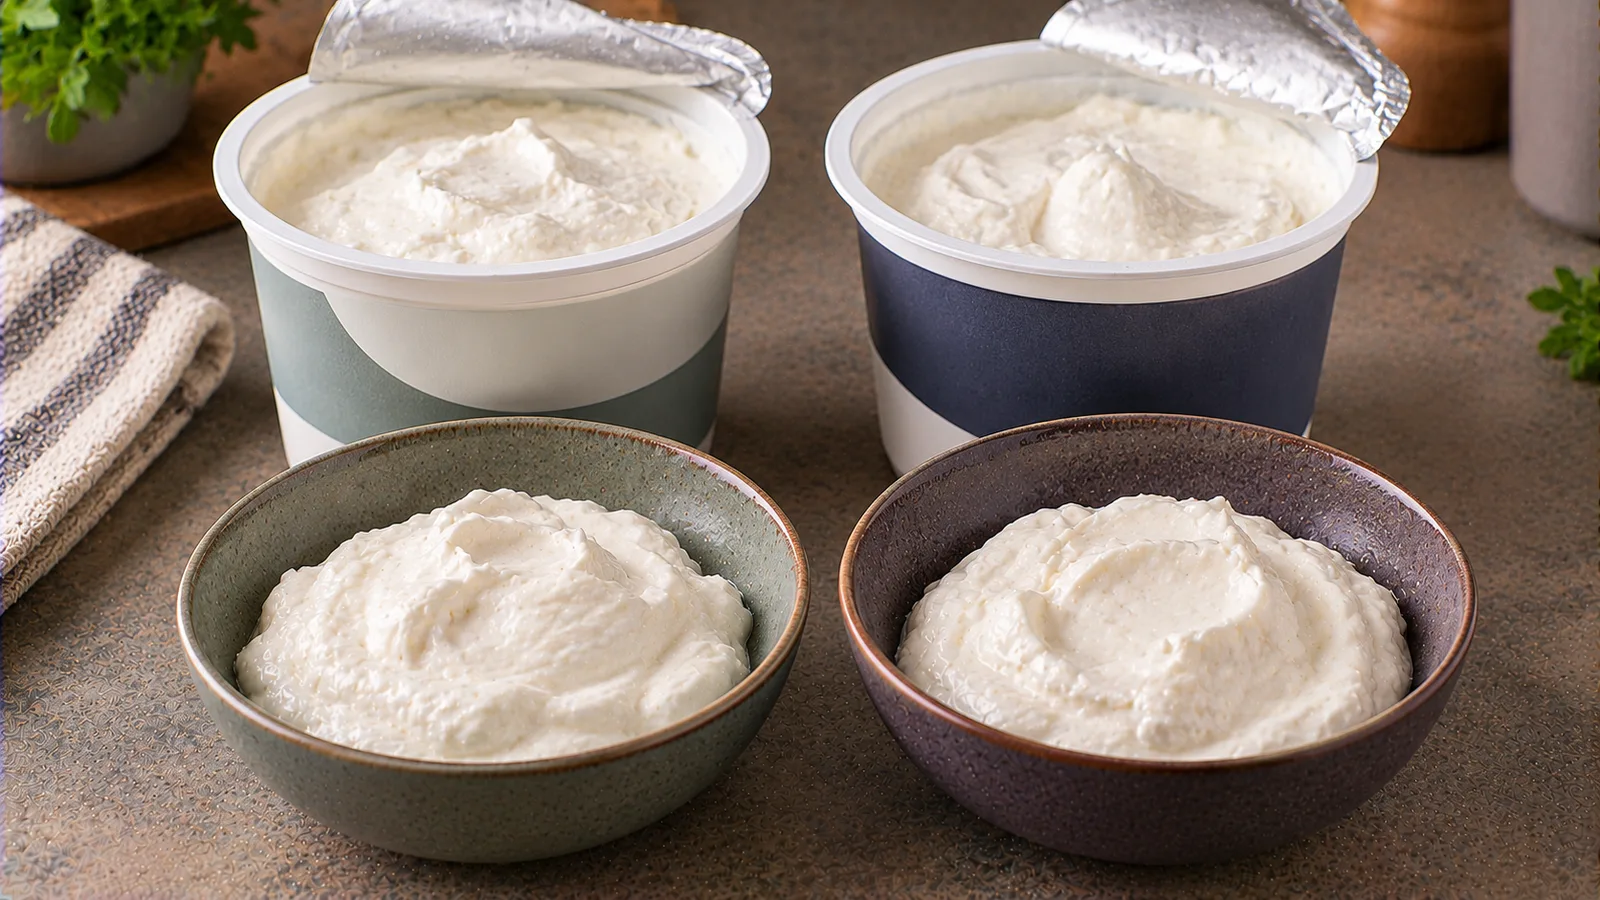
Compare REWE Bio and Arla plain skyr at equal protein portions, read 100 g labels and learn a reproducible protein-per-euro calculation without invented shelf prices.
Read article →