
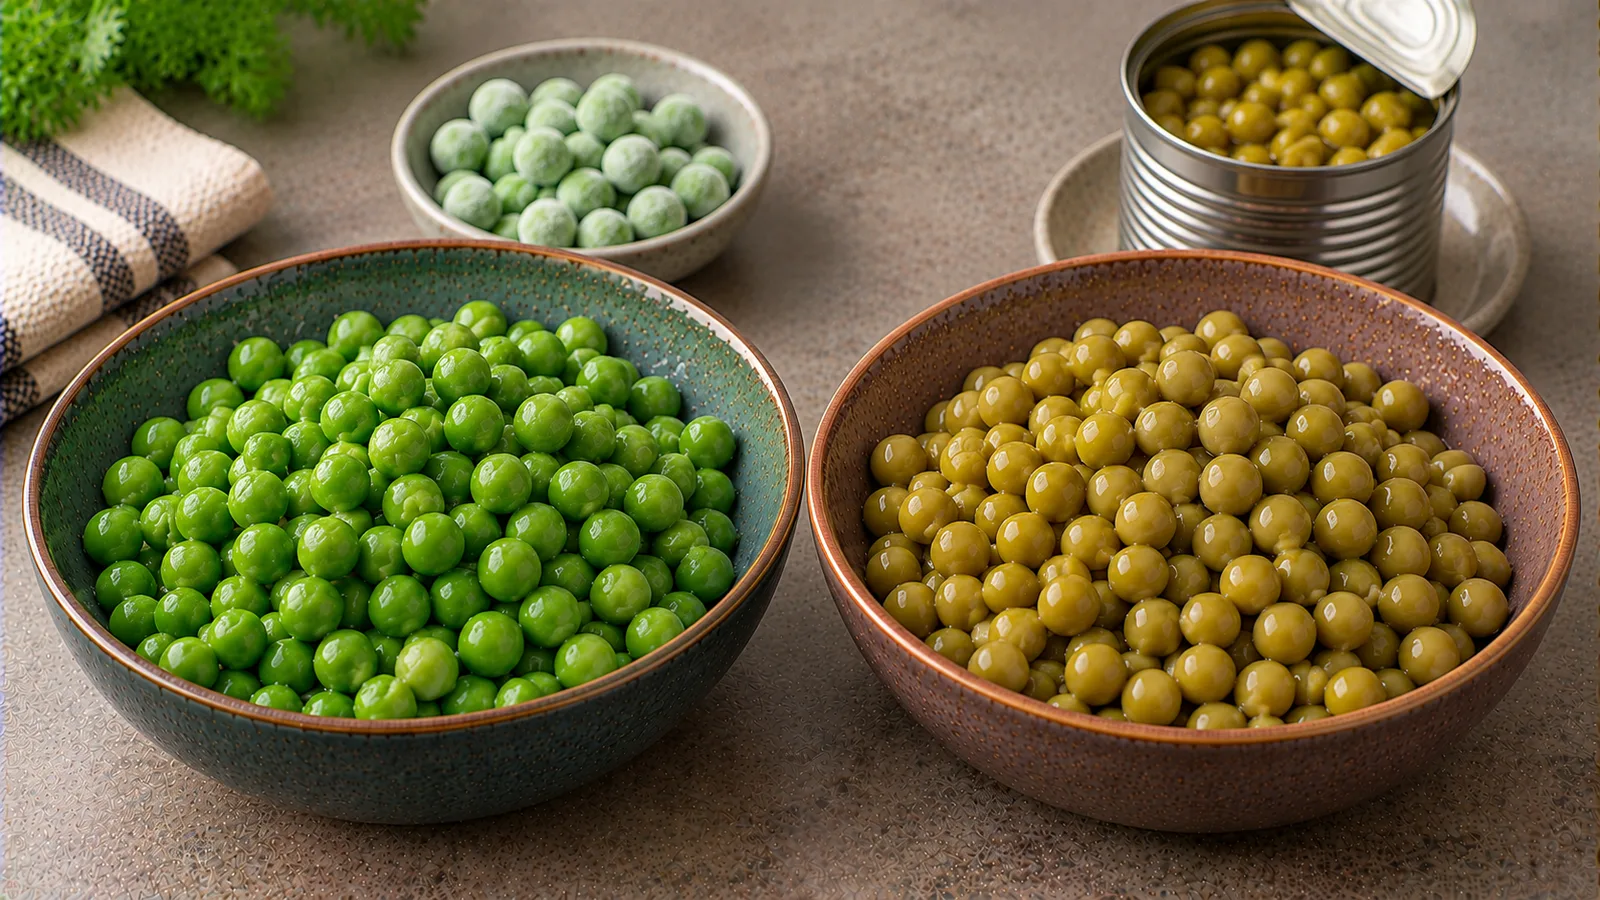
Frozen peas and canned peas are convenient ways to add green vegetables to dinner, but they are not automatically interchangeable on a nutrition label or a shopping receipt. Frozen peas usually need heating from frozen. Canned peas are already heat-processed and packed in liquid that you may drain. That liquid, the ingredients added during canning, and the weight after preparation all change how you should compare the products.
Here we compare a 150 g edible serving using a clearly named reference for frozen green peas cooked, boiled and drained without added salt and the published label for Bonduelle Junge Erbsen Feine Auslese. For a German cost illustration, the frozen purchase is Aldi Süd BIO Junge Erbsen, 750 g for €2.69, while the canned purchase is Bonduelle peas at EDEKA24, €1.89 per 400 g can with 280 g drained weight. These are two specific examples, not a claim that all frozen or canned peas have identical values or prices.
A 150 g serving: the numbers first
| For 150 g edible peas | Frozen peas, boiled and drained, USDA reference | Bonduelle canned peas, retailer label |
|---|---|---|
| Energy | 117 kcal | about 119 kcal |
| Total sugars | 6.6 g | 3.0 g |
| Salt / salt equivalent | 0.27 g | 0.87 g |
| Protein | about 7.73 g | 8.55 g |
| Preparation basis | Cooked, drained, no salt added to cooking water | Per-100-g product label; can has 280 g drained weight |
The USDA SR Legacy entry 170017 reports, per 100 g cooked peas, 78 kcal, 4.4 g sugars, 5.15 g protein and 72 mg sodium. Sodium is not the same thing as salt on an EU label. The salt-equivalent calculation is 72 × 2.5 ÷ 1,000 = 0.18 g per 100 g, or 0.27 g per 150 g. The EDEKA24 Bonduelle listing declares 79 kcal, 2.0 g sugars, 5.7 g protein and 0.58 g salt per 100 g. Multiplying every per-100-g quantity by 1.5 produces the serving figures above.
Important measurement limitation: the canned retailer page calls its nutrition table a per-100-g product declaration but does not independently document a laboratory analysis of a drained 150 g sample. The 280 g drained weight is documented for the price calculation. Check the precise label on your can before relying on the nutrient figures for a drained serving. The USDA entry and the Bonduelle label also concern different sources and pea preparations, so the values are indicative comparisons, not a controlled brand-to-brand experiment.
Salt: the larger difference in this example
In this comparison, the canned peas declare 0.87 g salt per 150 g, while the USDA boiled-frozen reference gives approximately 0.27 g salt equivalent. The numerical difference is 0.60 g for that amount of peas. The canned product contains added salt in its ingredient list. That does not mean that every can of peas contains this much salt: low-salt and no-added-salt versions also exist, and label values vary by supplier.
The wording matters. The frozen USDA record is labelled without salt added during cooking, not chemically sodium-free. Its 72 mg sodium per 100 g is still recorded and is converted to a salt equivalent for an EU-style comparison. Conversely, adding salt to your pot, a seasoned butter sauce or a stock cube can make a frozen-pea side much saltier than the plain reference.
For a fair home test, cook the frozen peas in water without added salt, drain them, and measure 150 g afterward. Drain the canned peas and weigh a separate 150 g portion. Only then add dressings or other ingredients; compare their salt separately. Draining or rinsing canned vegetables may change the sodium exposure, but without a product-specific analysis you cannot promise a particular reduction such as 20% or 50%.
Sugar: do not infer the result from the ingredients list
The selected canned peas list sugar as an ingredient; the label reports 2.0 g total sugars per 100 g, equivalent to 3.0 g per 150 g. The USDA cooked-frozen reference reports 4.4 g total sugars per 100 g, or 6.6 g for 150 g. In these two sources, the cooked-frozen reference therefore has 3.6 g more total sugars, even though the canned product includes added sugar.
This is not a demonstration that canning removes sugar or that boiling increases sugar. The samples, varieties, processing and reporting conventions differ. It would be misleading to compare these figures as though the same batch of peas had been divided in half and processed two ways. A packaged Aldi frozen-pea label, for example, declares 2.2 g sugars per 100 g of the frozen product; that is a different as-sold product basis from the cooked USDA record. You must not silently replace one basis with the other.
The ingredient list answers the question “Was sugar added?”; the nutritional table answers “How much total sugar is measured or declared in this product?” Those are related but not identical questions. If avoiding added sugar is your priority, inspect the canned ingredients and consider peas packed without added sugar. If tracking grams of total sugar, use the values and portion basis on the actual pack.
Cost: a 150 g serving is not half a 400 g can
The prices below are the listed examples on the consulted retailer pages, checked 22 October 2026. They are not a nationwide minimum-price guarantee. Aldi Süd and EDEKA24 are different retailers, and the frozen example is an organic store brand while the canned example is a branded product.
| Purchase | Advertised amount | Shelf price | Arithmetic for 150 g |
|---|---|---|---|
| Aldi Süd BIO frozen peas | 750 g frozen | €2.69 | €0.54 per 150 g frozen input |
| Bonduelle canned peas at EDEKA24 | 400 g total; 280 g drained | €1.89 | €1.01 per 150 g drained peas |
For frozen peas, €2.69 ÷ 750 × 150 = €0.538, rounded to €0.54. This is the cost of 150 g frozen, before cooking; it is not a confirmed cost for 150 g boiled and drained. For the can, €1.89 ÷ 280 × 150 = €1.0125, rounded to €1.01. Dividing the can price by its full 400 g would include liquid and understate the cost per edible pea portion.
To explore a cooked-price comparison, assume an illustrative 90% weight yield for the frozen peas after boiling and draining. Under that hypothetical assumption, 150 g cooked requires 166.7 g frozen and costs approximately €0.60: €2.69 ÷ 750 × 166.7. The gap in this scenario is €0.41 per 150 g edible (€1.01 canned minus €0.60 frozen). The actual frozen yield was not measured here; it may differ in your kitchen. No household should treat 90% as a universal cooking-yield fact.
Also distinguish a portion allocation from the amount paid at checkout. To buy canned peas you pay the full €1.89 can, not €1.01; the unused drained peas remain for a later meal. For a true price comparison, buy both products at the stores available to you, record current shelf prices, and weigh your cooked or drained yield. Transport, promotions and product tiers can easily reverse the result.
Which should you buy for a particular meal?
Frozen peas suit a week of flexible cooking: scoop out the amount needed, keep the rest frozen, and heat the peas following the bag instructions. For soups, rice dishes or a hot vegetable side, this reduces dependence on opening an entire can. The chosen frozen nutrition benchmark is lower in salt equivalent than the selected canned label, provided that you do not add salt during preparation.
Canned peas are useful when freezer space is limited, when you need a shelf-stable pantry ingredient, or when you want already-cooked peas for a fast meal. Drain them, check the ingredients and salt line, and adjust any additional salty seasoning accordingly. Canned peas can be softer than briefly cooked frozen peas, which may be an advantage for a mash or disadvantage for a salad.
For a rice bowl with mixed vegetables, compare the vegetable portions independently. The article frozen peas versus canned sweetcorn contrasts frozen peas with canned sweetcorn, which is a different food and a different buying question. If you mainly want a freezer-to-pan vegetable side, frozen versus canned green beans examines frozen versus canned green beans; its numbers are not substitutes for pea labels.
Three reliable ways to compare packs in a shop
- Match the ingredient. Look for garden peas on both products, not split peas, chickpeas or peas mixed with carrots. A mixed-vegetable tin has a different nutrition profile.
- Match the measurement basis. For frozen peas, read whether nutrition is given as sold or prepared. For canned peas, find the drained weight; use it for cost. The can's nutrient table may use a differently stated preparation basis, so inspect the label closely.
- Compare the same edible weight. Use 150 g of peas that you actually serve, then calculate salt and total sugar from the appropriate nutrient basis. Compare cost using the amount paid divided by edible yield, rather than by the weight of liquid in the can.
If you batch-cook frozen peas, follow the heating and storage instructions on the package. After opening a can, refrigerate any leftovers promptly in a suitable covered container. The USDA guidance for opened low-acid canned foods lists 3–4 days refrigerated for foods including canned peas; the particular product label may prescribe a shorter period, so use the shorter instruction.
What this comparison can and cannot tell you
The numbers show one transparent nutritional reference and two named German retail examples, not a blanket ranking of every frozen or canned pea on the market. Salt levels are especially brand-dependent. Total sugars can vary even when sugar appears on one ingredient list and not the other. For prices, cooking yield, can drainage and retailer choice change the denominator. The stronger decision is not “frozen always wins”; it is knowing which 150 g edible serving you are comparing.
Sources
- USDA FoodData Central, SR Legacy record 170017 — frozen green peas, cooked, boiled and drained without salt. Numeric baseline for the cooked frozen sample.
- Aldi Süd — BIO Junge Erbsen, 750 g. Frozen pack price and as-sold nutrition label; a different basis from the USDA cooked record.
- EDEKA24 — Bonduelle Junge Erbsen Feine Auslese, 400 g, 280 g drained. Canned price, weight and declared nutrition per 100 g.
- European Commission — Nutrition labelling. Context for interpreting nutrition tables and salt declarations.
- USDA FSIS — Refrigerating opened canned foods. Storage period for opened low-acid canned vegetables.