
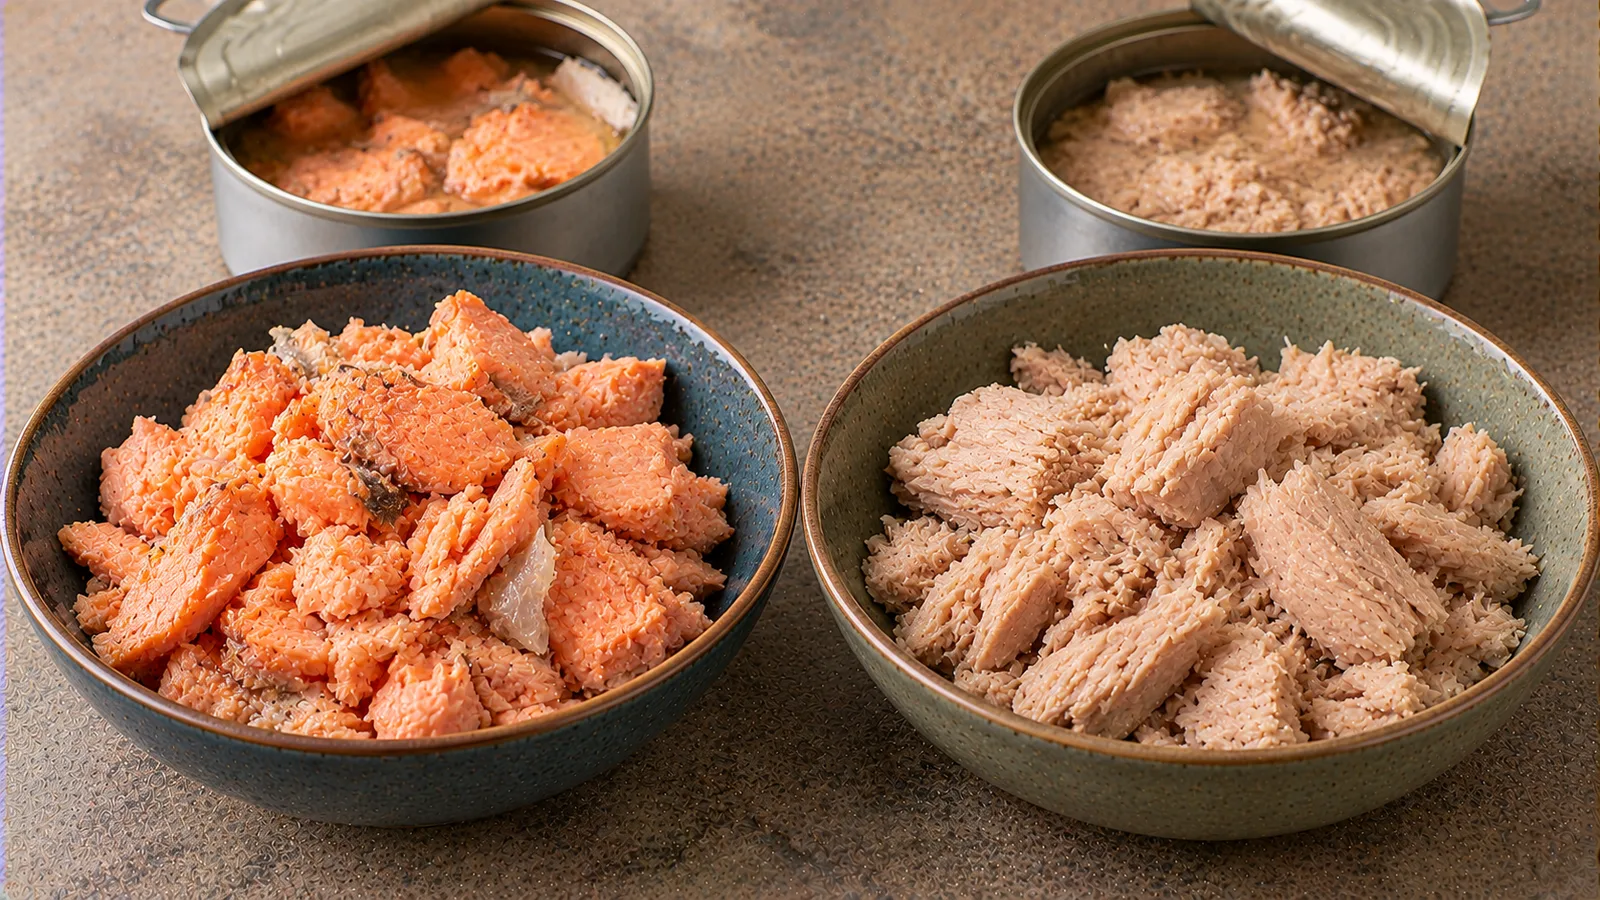
Canned salmon and canned tuna are both convenient fish for a sandwich, salad or quick dinner. But the answer to “which has more protein or calcium for the money?” depends on which canned fish, whether soft bones are included, and the drained weight. Comparing the printed weight of two tins can be misleading because liquid is not the same as the edible fish you put on a plate.
Here, the nutrition comparison uses 100 g of drained edible fish from clearly identified USDA reference foods: canned pink salmon (including its usual edible components) and canned light tuna in water. The price example uses two named German online listings, whose drained weights are known. These are two separate comparisons: USDA reference nutrients are not laboratory measurements of the two retail brands.
Quick comparison: 100 g drained fish
| Measure | Canned pink salmon, general reference | Canned light tuna in water |
|---|---|---|
| Protein | 23.1 g | 19.4 g |
| Calcium | 283 mg | 17 mg |
| Energy | 138 kcal | 86 kcal |
| Fat | 5.02 g | 0.96 g |
| Preparation basis | Canned, drained solids | Canned in water, drained solids |
These are USDA FoodData Central pink-salmon values for FDC 175175 and USDA light-tuna values for FDC 173709. The table deliberately avoids claiming that a specific supermarket tin contains those exact nutrients. Salt, tuna species, trimming and bone removal can change the result.
In these reference entries salmon provides 3.7 g more protein and 266 mg more calcium per 100 g, but this is not a universal ranking for every can. The striking calcium gap deserves a separate explanation before making a purchase decision.
Why soft salmon bones change the calcium result
Canned salmon can contain skin and soft, pressure-cooked bones. When those bones are edible and actually eaten, their minerals contribute to the portion. The general canned-pink-salmon record above lists 283 mg calcium per 100 g. That should not be transferred to a boneless, skinless fillet.
USDA has a separately described canned pink salmon without skin and bones record, FDC 173724, with approximately 60 mg calcium and 24.6 g protein per 100 g. Removing bones can therefore substantially lower the calcium estimate even when the food remains canned salmon. Some shoppers choose to crush soft edible bones into a filling; others remove them for texture. Do not force hard or unexpectedly sharp bones into food, and check a product's instructions and suitability for the person eating it.
The tuna example has 17 mg calcium per 100 g, according to the selected drained-light-tuna reference. A tuna can does not suddenly gain the salmon-with-bones calcium value because both foods are seafood. Conversely, a boneless salmon can should not be described as having 283 mg without confirming its formulation.
Practical check: read “with skin and bones,” “skinless and boneless,” and the ingredients on the tin. Calcium is not always declared on a European packaged-food nutrition panel; an absent calcium number is not proof of zero calcium. For an exact product-specific value, you would need a reliable manufacturer declaration or analysis.
Protein: close enough that the label matters
The USDA comparison is 23.1 g protein per 100 g for the selected canned pink salmon and 19.4 g for canned light tuna in water. The difference is 3.7 g, not a reason to assume salmon always wins. A different canned tuna brand can declare more than 23 g protein per 100 g, while a particular salmon product may vary with liquid, bones and other ingredients.
For an example 130 g drained portion, scaling the USDA numbers yields approximately 30.0 g protein from salmon (23.1 × 1.3 = 30.03) or 25.2 g from tuna (19.4 × 1.3 = 25.22). This is only a hypothetical equal-weight nutrition calculation. It is not the actual protein content of the different retail packs used for the price comparison below.
A person making two sandwiches can divide one can between them and then use the actual drained weight to estimate protein from the package label. If a label's protein number is stated per 100 g, multiply it by the amount of fish eaten in grams divided by 100. Do not count discarded water as part of the fish portion.
Price: compare edible drained weight, not the big number on the lid
To make the cost calculation checkable, we use two published German online offers viewed for this comparison on 22 October 2026:
- LA COMTESSE canned pink salmon: a 213 g tin with a declared 180 g drained weight, listed for €5.59 at Dunekacke. The product is described as containing skin and bones.
- followfood tuna fillets, natural: a 130 g drained-weight listing for €2.99 at Rossmann. This is tuna in its own juice, not tuna in oil.
The calculation is: cost per 100 g drained fish = pack price ÷ drained grams × 100.
| Dated product example | Pack cost and drained weight | Theoretical cost / 100 g drained |
|---|---|---|
| LA COMTESSE canned pink salmon | €5.59 ÷ 180 g × 100 | €3.11 |
| followfood natural tuna | €2.99 ÷ 130 g × 100 | €2.30 |
This works out to about €0.81 more per 100 g for the salmon example after rounding. You still pay €5.59 or €2.99 for the entire tin at checkout; €3.11 and €2.30 are allocated amounts, not separate 100 g products. Delivery fees, promotions, regional availability and any food discarded after opening are excluded. The two prices come from different shops and are not a permanent market-wide ranking.
The retailer's 213 g total weight is not the proper denominator for the salmon if you drain the liquid. Using 213 g would artificially lower its stated cost per edible fish portion. If you also discard the soft bones, your actual consumed weight may be lower than the declared 180 g drained weight, increasing your personal cost per 100 g eaten.
What if the salmon bones are removed?
The retail price calculation assumes you use the 180 g drained contents. When a shopper removes skin or bones after draining, the usable fish weight changes. We do not invent a trimming percentage: weigh the portion you keep and redo the arithmetic with that amount.
For example, if a tin has a different actual edible yield than its printed drained weight, €5.59 ÷ measured edible grams × 100 gives a more honest cost. Remember that the same action changes which nutrient reference is appropriate. It would be inconsistent to charge only for boneless flesh while retaining the 283 mg calcium figure associated with the general canned-salmon profile.
This distinction is especially important for preparing a child's meal or a smooth sandwich filling: texture preferences may lead someone to remove the bones, so a higher-calcium comparison no longer applies automatically.
Which one works for common meals?
For a calcium-focused meal: canned salmon with soft edible bones can be the more interesting choice if the bones are genuinely included and eaten. Add it to mashed potatoes, patties or a spread after checking texture and safely handling the fish. The general reference's 283 mg calcium is a useful illustration, not a label promise.
For a low-cost fish sandwich: the named tuna offer has the lower illustrative 100 g drained cost. Mix drained tuna with chopped vegetables and a modest amount of dressing. If you want to know the finished sandwich's nutrients, include bread and additions separately.
For protein: either can contribute a substantial amount. The USDA examples supply 23.1 g and 19.4 g respectively per 100 g, but the actual packaging label should determine the quantity for your chosen brand.
For taste and preparation: pink salmon is often softer and more distinctively salmon-flavoured; tuna in water tends to make firm flakes and can be a convenient salad topping. This is a culinary preference rather than a health ranking.
The distinctions differ from salmon versus sardines and tuna versus sardines, which compare each fish with sardines. Here the specific purchase question is canned salmon versus canned tuna, with bone handling and drained-weight cost both included.
Mercury, allergens and canned-fish safety
Species matter. The FDA/EPA fish advice places salmon and canned light tuna (including skipjack) in its “Best Choices” category for mercury. Albacore/white tuna and yellowfin tuna are in “Good Choices,” while bigeye tuna is in “Choices to Avoid.” This is why advice about “tuna” without naming the species can be misleading, particularly for pregnancy, breastfeeding and children.
The FDA/EPA advice for pregnancy and breastfeeding gives 2–3 servings a week from Best Choices, rather than recommending the same fish at every meal. Children have age-adjusted serving sizes. Follow the guidance relevant to your situation and jurisdiction; the price table does not establish a safe frequency of consumption.
Both products contain fish, an allergen. Check for additional ingredients and relevant cross-contact statements. Inspect tins for swelling, leaks or severe damage; do not taste food from a suspect can. Refrigerate opened fish promptly in a suitable covered container and follow the package's stated use-after-opening instructions. A closed shelf-stable tin and opened leftovers have different storage requirements.
How to repeat the comparison in any supermarket
- Identify the species and form: pink salmon with edible bones, boneless salmon, skipjack/light tuna, or albacore are not interchangeable references.
- Note the drained weight. If none is printed, drain and weigh the fish yourself rather than treating water or oil as edible fish.
- Compare protein from the actual per-100-g label. Treat any undeclared calcium figure as unknown, not zero.
- Calculate pack price × 100 ÷ drained weight; if bones are removed, use the weight you actually eat.
- Review salt, allergens, storage instructions, mercury guidance and the cost of the whole tin before deciding.
The best choice is conditional: the referenced whole canned salmon has much more calcium when edible bones are retained; the two USDA protein values are relatively close; the specific tuna offer has the lower illustrative drained-portion cost. None of those three conclusions should be copied unchanged onto different products without reading their labels.
Sources
- USDA FoodData Central, SR Legacy, FDC 175175 — canned pink salmon, drained solids.
- USDA FoodData Central, SR Legacy, FDC 173724 — canned pink salmon without skin and bones.
- USDA FoodData Central, SR Legacy, FDC 173709 — light tuna in water, drained solids.
- LA COMTESSE canned pink salmon, Dunekacke retail listing.
- followfood natural tuna, Rossmann retail listing.
- US FDA/EPA advice about eating fish and mercury categories.
USDA entries describe reference foods; retailer listings describe pack prices and drained weights. The two types of data should not be mistaken for measurements of the same physical cans. Prices are dated and may change.