
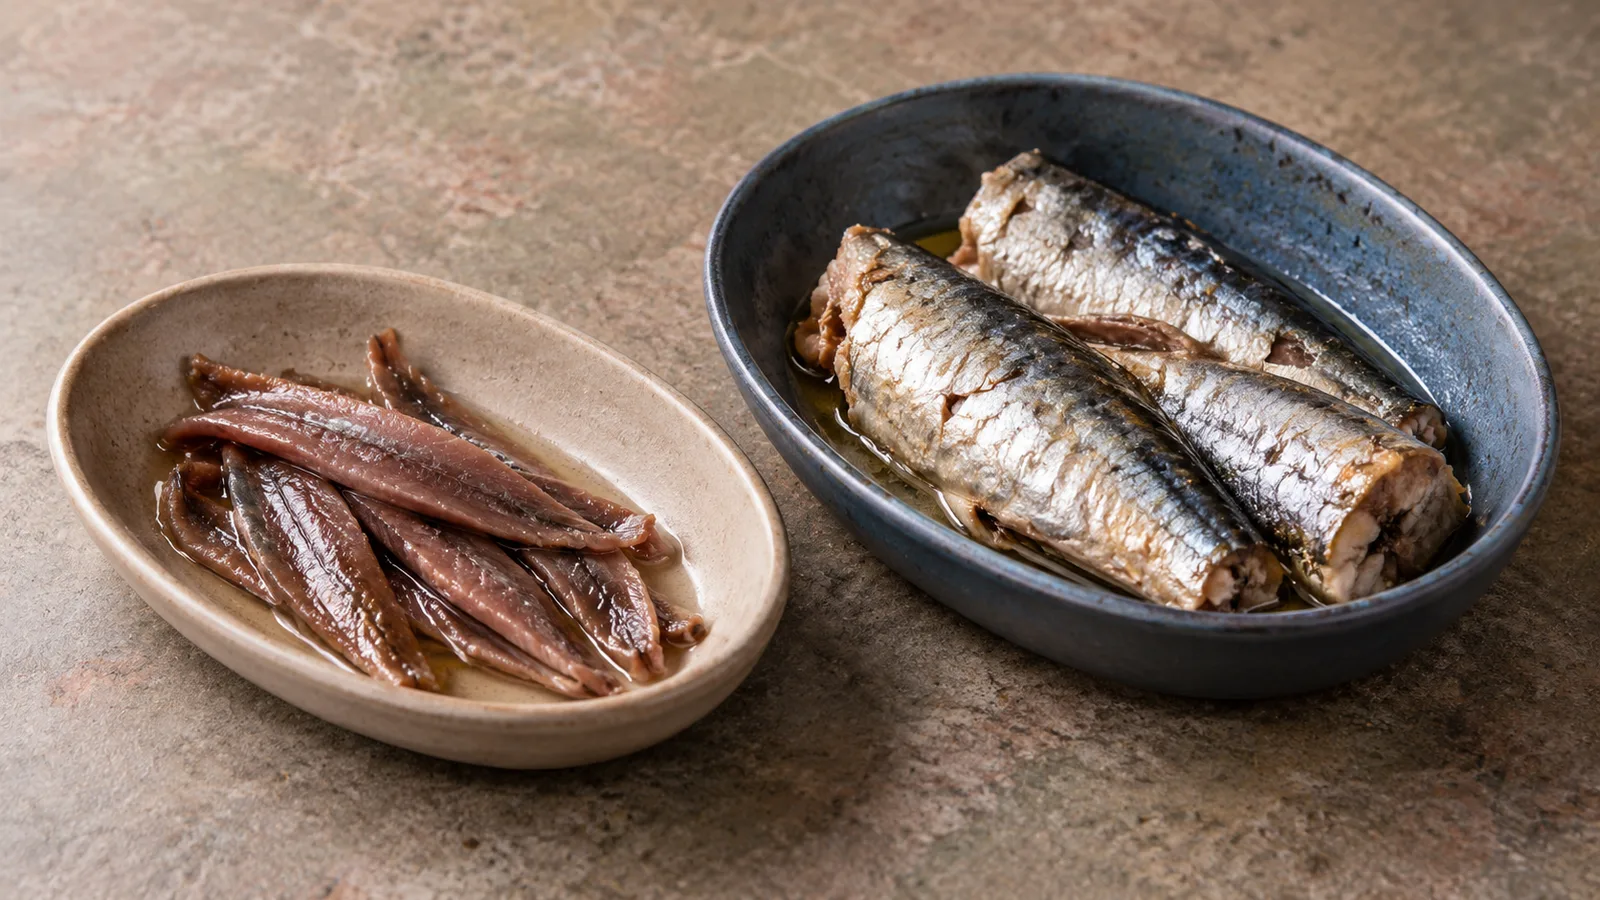
Anchovies and sardines are both small oily fish, but the supermarket products sold under those names often do very different jobs. A few preserved anchovy fillets can season a whole tomato sauce. A tin of sardines can become the main protein in a lunch. Comparing their nutrients per 100 g is useful; treating a 15 g anchovy topping as interchangeable with a 90 g sardine meal is not.
This comparison uses European anchovies canned in oil, drained solids and Atlantic sardines canned in oil, drained solids with bone from USDA Standard Reference records. It then calculates two realistic edible servings and a transparent hypothetical euro-price example. Salt-cured anchovies, lower-salt marinated anchovies, brined sardines and tomato-packed sardines are not identical to these records. Use your package label when buying a specific product.
The short answer: seasoning fish versus meal fish
In these particular reference foods, preserved anchovies are more concentrated in protein per 100 g, but much higher in sodium. Sardines give substantial protein in a normal tin-sized portion with far less salt in the USDA example. Both offer marine omega-3 fats, including EPA and DHA; the actual quantity varies by species, processing and packing medium. Neither deserves an automatic “healthier” badge.
The practical decision starts with three questions: How many drained grams will you actually eat? What does your packet say for salt per 100 g? And are you comparing the cost of a garnish or a substantial fish serving? Those questions avoid most misleading comparisons.
Nutrition per 100 g: use the same edible state
The values below come from two specific USDA SR Legacy food descriptions. The U.S. database lists sodium; the table also gives salt equivalent, calculated as sodium × 2.5 in line with EU food-labelling rules. Salt equivalent is a calculation, not a claim that a lab measured exactly that amount of added table salt.
| Per 100 g drained edible fish | Anchovies in oil, drained | Sardines in oil, drained with bones |
|---|---|---|
| Energy | 210 kcal | 208 kcal |
| Protein | 28.89 g | 24.62 g |
| Fat | 9.71 g | 11.45 g |
| Sodium | 3,668 mg | 307 mg |
| Calculated salt equivalent | 9.17 g | 0.77 g |
Sources: USDA anchovy SR Legacy food 174183 and USDA sardine SR Legacy food 175139. The wording “with bone” matters: soft edible bones can contribute calcium. A boneless product or a brand with different fish-to-oil proportions will differ.
Notice that calories are almost the same per 100 g here, despite the big difference in salt. Do not assume anchovies are inherently a low-calorie alternative to sardines. The two cans may contain different amounts of oil, and the reference numbers already describe drained fish, not the oil you pour over bread or pasta.
What you really eat: 15 g of anchovies versus 90 g of sardines
A realistic anchovy addition might be 15 g of fillets spread across pasta, pizza or vegetables. A simple sardine lunch might use 90 g of drained fish. Applying the reference per-100-g values to those actual edible amounts gives:
| Drained serving | Anchovies: 15 g | Sardines: 90 g |
|---|---|---|
| Energy | 31.5 kcal | 187.2 kcal |
| Protein | 4.33 g | 22.16 g |
| Fat | 1.46 g | 10.31 g |
| Sodium | 550 mg | 276 mg |
| Calculated salt equivalent | 1.38 g | 0.69 g |
Here the anchovy portion delivers about one-fifth the protein of the sardine portion while contributing about twice the salt equivalent, even though it weighs one-sixth as much. This is an example of portion-size reasoning, not a rule for every brand of anchovies. To avoid confusing package serving size with what is eaten, see Mealisa’s portion-size explanation only if you need the broader measurement background; the comparison above uses edible grams throughout.
If you use 30 g of the reference anchovies instead of 15 g, double their figures: around 8.67 g protein and 2.75 g salt equivalent. Doubling the sardine portion from 45 g to 90 g similarly doubles nutrients. Those relationships follow from the weights; no biological threshold is implied.
Why anchovy sodium can be so high
Many anchovy fillets sold in jars or tins are salted or cured before being packed in oil. Salt is part of both the taste and preservation process. The resulting fillet is compact, intense and usually added in small amounts. That is why the product type matters more than the word “anchovy” alone.
The database example has 3,668 mg sodium per 100 g. For EU-style labels, multiply grams of sodium by 2.5 to estimate salt: 3.668 g sodium × 2.5 = 9.17 g salt equivalent. That does not mean one 15 g garnish has 9.17 g salt: the 15 g garnish has approximately 1.38 g. For more on the distinction, Mealisa’s sodium-versus-salt guide explains the label conversion and units.
Not every anchovy is cured this heavily. Fresh anchovies, milder vinegar-marinated fillets and salt-reduced products can have materially different values. Sardines packed in brine may contain more salt than the reference sardines in oil. When monitoring sodium intake, compare the actual labels, per drained portion, rather than trusting a fish-name ranking. Rinsing an oil-packed fillet might affect taste and surface seasoning but cannot be relied upon to produce a quantified sodium reduction without a product-specific test.
Protein: 100 g versus one useful portion
The 28.89 g versus 24.62 g protein result favors reference anchovies per 100 g. But 100 g of strongly salted anchovy fillets is an unusually large seasoning portion. For an ordinary protein-focused meal, a larger sardine serving is often simpler to use. In our 90 g example, sardines supply 22.16 g protein without requiring 90 g of intensely salted fillets.
Consider the complete dish. Anchovies mixed into a tomato sauce contribute a few grams of protein and a strong savory taste; beans, pasta, vegetables and cheese, if used, add their own protein and energy. A sardine sandwich with vegetables or a sardine-and-potato salad contains a fuller portion of fish; bread, oil and dressing must be counted separately. The best question is not “Which fish wins protein?” but “How much protein comes from the fish I actually plan to eat?”
For a separate look at the nutrition and portion sizes of the individual foods, use the anchovy food guide or the sardine food guide. Those ingredient pages serve a different search need from this head-to-head product comparison.
Omega-3: both supply EPA and DHA, but check the exact product
Anchovies and sardines are oily marine fish. They supply the long-chain omega-3 fatty acids EPA and DHA, which are different from plant-derived ALA. The NIH Office of Dietary Supplements explains these forms and lists, for example, 0.74 g EPA and 0.45 g DHA per 3 oz of canned sardines in tomato sauce, drained. That specific example is not the same food record as the oil-packed sardines used in our protein/salt table. Do not copy the 1.19 g total into an oil-packed tin without evidence.
An exact EPA+DHA comparison would require species, edible weight and analytical data for both products. A package saying “omega-3” without a quantity cannot support a precise price-per-gram-EPA+DHA claim. Some manufacturers provide DHA and EPA separately; others give only a total omega-3 figure or none at all. Also, draining oil does not automatically remove or retain a fixed percentage of omega-3: processing and the oil itself affect the result.
For most shoppers, a reasonable approach is to select varied oily fish they enjoy and can afford, compare salt, and use product-specific omega-3 values when available. Fish is food, not a guaranteed medical treatment, and a larger serving of salty preserved fish is not automatically the best route to more EPA and DHA.
Costs: two buying situations, not real-time store prices
To show how to compare cost, assume a jar containing 50 g drained anchovy fillets costs €2.19 and a tin containing 90 g drained sardines costs €1.39. These are hypothetical teaching prices—not verified retailer prices, not averages and not forecasts. The package's drained weight, rather than total oil-and-fish weight, is the denominator.
| Price calculation using hypothetical packages | Anchovies | Sardines |
|---|---|---|
| Drained fish per package | 50 g | 90 g |
| Assumed checkout price | €2.19 | €1.39 |
| Price per 100 g drained fish | €4.38 | €1.54 |
| Illustrated portion | 15 g | 90 g |
| Cost of fish used in illustrated portion | €0.66 | €1.39 |
| Cost per 10 g reference protein | €1.52 | €0.63 |
How the first row is derived: €2.19 ÷ 50 g × 100 = €4.38 per 100 g; €1.39 ÷ 90 g × 100 ≈ €1.54 per 100 g. The per-10-g-protein metric divides the unrounded cost per 100 g by protein per 100 g and multiplies by ten. It does not price a complete prepared meal, establish protein quality or account for the taste impact of anchovies.
If you open the entire €2.19 jar for a sauce but use only 15 g, €0.66 is the cost attributed to that dish, not what you spend at the till. You still paid €2.19; the unused 35 g is an ingredient with a storage limit and possible waste. The sardine example uses the whole drained 90 g package, so the dish cost and checkout cost happen to match.
How to read a tin or jar in a real shop
Start with the front to confirm whether you are holding cured anchovy fillets, plain fish, sardines with bones, sardines in tomato sauce or a flavored product. Then turn to the ingredients and nutrition panel. Check the drained net weight (if stated), protein, salt or sodium per 100 g, and any separate values for EPA and DHA. The packed liquid and edible fish are different quantities.
A useful mini-calculation is straightforward. If a jar says salt 8.0 g per 100 g and you eat 12 g drained fish, then salt from those fillets is about 0.96 g (8.0 × 12 ÷ 100). This is a hypothetical label example, independent of the USDA anchovy record. If a sardine tin states 0.9 g salt per 100 g and contains 100 g drained fish, the entire fish portion contributes about 0.9 g salt; sauces, crackers and seasonings add extra salt.
Because brands differ, preserve evidence from the actual product label if you are tracking nutrients. For a broader canned-fish contrast involving tuna, see the tuna-versus-sardines comparison; it answers a different choice from anchovy seasoning versus sardine portions.
Bones, packing media and other differences worth noticing
Sardines sold with soft edible bones can add calcium, while a boneless product may provide less. Some anchovy fillets contain bones too, but a 15 g flavoring quantity should not be treated as nutritionally equivalent to a whole tin of bone-in sardines. Do not quote a calcium value for one fish as though it applied to all preserved forms.
Fish packed in olive oil, sunflower oil, brine or tomato sauce differ in calories, salt and sometimes added ingredients. “In olive oil” describes the packing medium, not the actual amount consumed. Weighing drained fish and separately logging any consumed oil is more reproducible than assuming that all oil listed on a tin enters the meal.
Allergy is another straightforward difference to neither fish: both are fish and unsuitable for someone with a fish allergy unless their specialist advises otherwise. Check local allergen labels and cross-contact. For people managing high blood pressure or prescribed sodium restrictions, the particular salty anchovy product may require extra attention, but do not substitute this article for individual medical advice.
Mercury and choosing fish safely
The FDA/EPA fish advice places both anchovies and sardines among its “Best Choices” for lower-mercury seafood. That does not mean eating unlimited quantities or ignoring product salt. Pregnancy, breastfeeding and children's serving guidance use different portion assumptions from our 15 g and 90 g meal illustrations.
Unopened shelf-stable products follow the printed storage instructions. After opening, refrigerate promptly and transfer leftovers to a covered food-safe container for best quality. USDA FSIS gives about 3–4 days for opened low-acid canned foods including fish; follow a shorter package instruction when given. Keep chilled fish cold during transport. Discard products with unusual spoilage signs and never taste food from a suspect container to test whether it is safe.
Which is better for the job?
Choose a small amount of cured anchovy when you need concentrated savory flavor in a sauce, dressing or vegetable dish and can accommodate its salt. Choose a full drained sardine portion when you want a practical fish component of lunch with substantial protein and usually a less intense sodium load than heavily cured anchovies. Both can be used in varied seafood eating patterns; both have versions that deviate from this exact comparison.
The final supermarket decision is a three-part check: product type, drained grams and actual label values. Then compare the amount you will eat and calculate the price of that edible amount. A precise cost comparison is more valuable than calling either fish categorically “cheaper,” “healthier” or “higher in omega-3” based on the product name alone.
Sources
- USDA FoodData Central — European anchovy, canned in oil, drained; SR Legacy 174183.
- USDA FoodData Central — Atlantic sardine, canned in oil, drained with bone; SR Legacy 175139.
- EU Regulation 1169/2011 — sodium-to-salt labelling conversion.
- NIH Office of Dietary Supplements — Omega-3 Fatty Acids.
- FDA/EPA — Advice About Eating Fish.
- USDA FSIS — Refrigerating food after opening a can.