
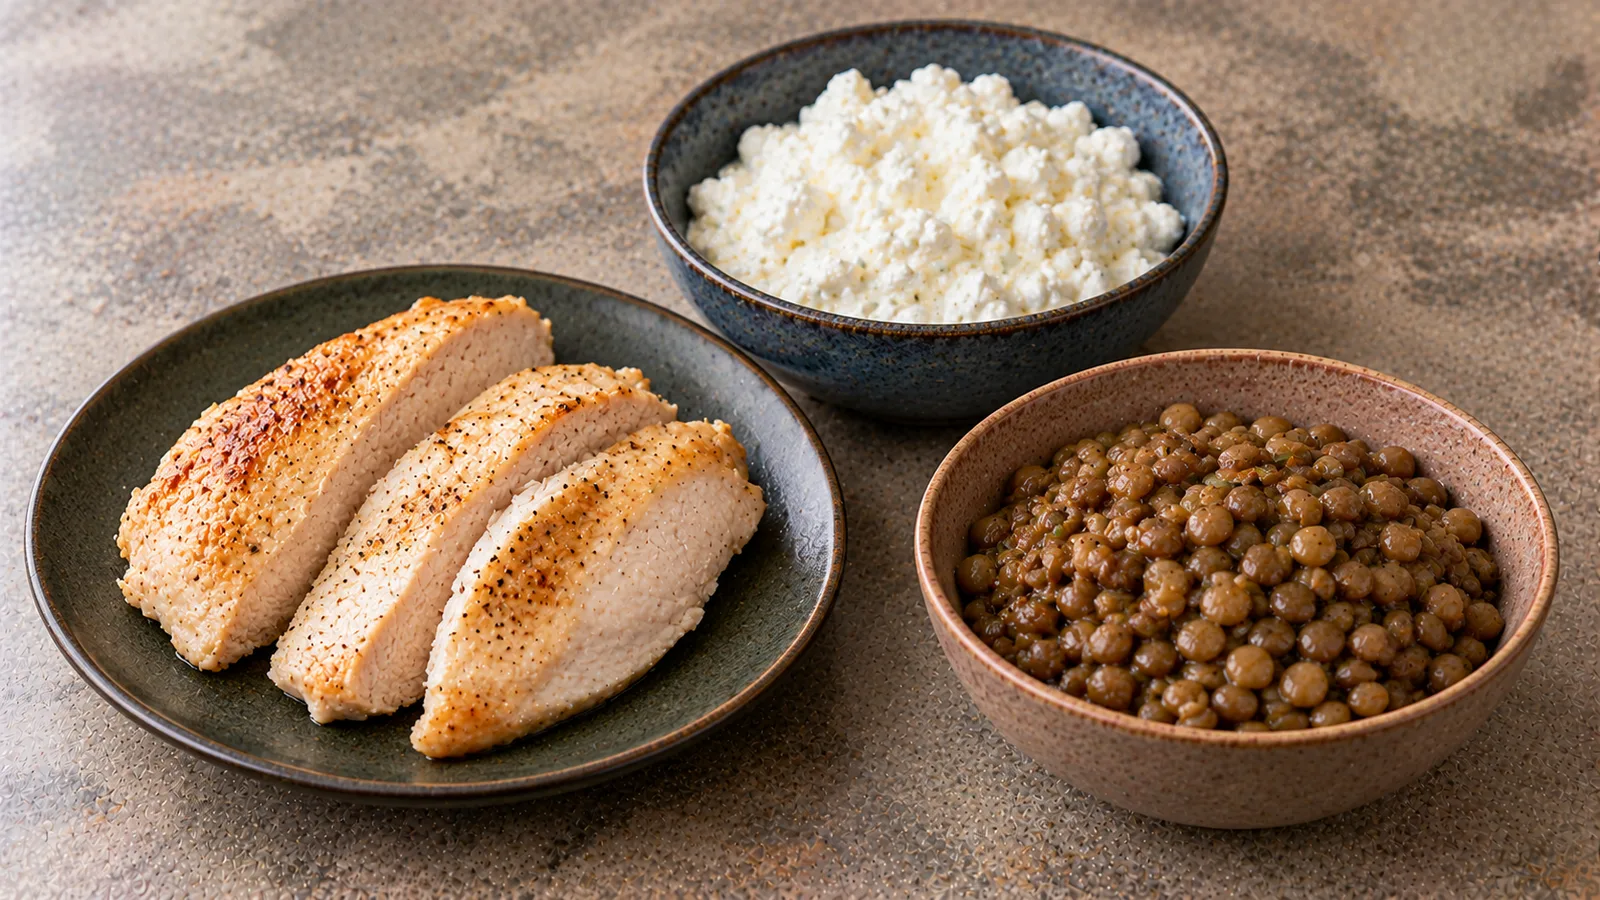
Knowing that a food contains “20 g of protein” is not enough to decide whether it fits a breakfast, a grocery comparison or a calorie-limited meal. You need the reference quantity. The same food can look impressive per 100 g of dry product, less concentrated after hydration, and useful again when you measure the protein in the portion you actually eat. A different ranking emerges when calories, rather than grams of food, form the denominator.
This guide answers a practical grocery-shopping question: when should you compare protein per 100 g, per serving or per 100 kcal? It uses four identifiable products and one transparent worked model, not a universal “best protein food” league table. We do not mix raw labels with cooked-database values without naming the food state.
The short decision rule
Use per 100 g to compare similar foods sold in the same physical state. Use per serving to plan how many grams of protein your actual meal contributes. Use per 100 kcal when the question is how much protein fits into an energy budget. None is automatically the fairest unit for every decision.
For two cartons of plain quark, the per-100-g column is a sensible starting point. For dry soy mince versus a bowl of cooked lentils, it can be deceptive: much of the difference comes from absorbed water. For a person who wants about 20 g protein at breakfast, the relevant test is what realistic combination and portion delivers it, not which package has the biggest bold number.
These are quantity measures, not measures of protein digestibility, amino-acid balance, price, sustainability or suitability for a medical diet. Those require separate evidence.
Four grocery products, measured in the same state as their labels
Our reference foods are dmBio plain rolled oats, dmBio dry red lentils, dmBio dry textured soy pieces, and ja! low-fat quark. The first three labels refer to uncooked dry foods; the last refers to a refrigerated food eaten as sold. The energy and protein figures below are taken from their specific online product pages, not guessed USDA averages.
| Example product and labelled state | kcal per 100 g | Protein per 100 g | Protein per 100 kcal |
|---|---|---|---|
| dmBio rolled oats, dry | 372 | 14 g | 3.76 g |
| dmBio red lentils, dry | 341 | 26 g | 7.62 g |
| dmBio textured soy, dry | 371 | 52 g | 14.02 g |
| ja! low-fat quark, as sold | 67 | 12.3 g | 18.36 g |
The last column is calculated as protein per 100 g ÷ kcal per 100 g × 100. For example, dry soy provides 52 ÷ 371 × 100 = 14.02 g protein per 100 kcal. Low-fat quark provides 12.3 ÷ 67 × 100 = 18.36 g. Consequently, soy leads the per-100-g ranking, while quark leads this particular per-100-kcal comparison.
The individual labels are available for oats, lentils, textured soy and quark. Recipes, batches and replacement brands will change the numbers.
What “per 100 g” answers—and what it does not
The 100-g basis is consistent and useful when you are comparing two dry lentil packets, two cereal boxes, or two similar dairy products. In the European Union, nutrition declarations normally express energy and key nutrients per 100 g or 100 ml under Regulation (EU) 1169/2011. A portion column can appear additionally, but it is not a substitute for identifying the actual amount eaten.
The limitation is obvious once water enters the picture. A hundred grams of dry lentils is not the same meal-sized quantity as a hundred grams of cooked lentils. A hundred grams of dry textured soy may be more than twice as much as a practical uncooked portion. The label is not misleading; the comparison question is different.
Nor is “per 100 ml” necessarily interchangeable with “per 100 g”. Liquids are commonly labelled by volume, while semi-solid dairy foods often use mass. If converting, use an actual density or product-specific serving statement rather than silently assuming every liquid weighs exactly one gram per millilitre.
EU labelling information: European Commission nutrition labelling and Regulation 1169/2011.
The real serving reverses the story again
Consider portions that someone might plausibly use: 50 g dry oats, 75 g dry lentils, 50 g dry soy pieces and 200 g plain quark. These are illustrative portions, not recommendations for everybody. Multiply the label number by the portion weight divided by 100.
| Product | Counted quantity | Protein in portion | Energy in portion |
|---|---|---|---|
| Rolled oats | 50 g dry | 7.00 g | 186.00 kcal |
| Red lentils | 75 g dry | 19.50 g | 255.75 kcal |
| Textured soy | 50 g dry | 26.00 g | 185.50 kcal |
| Low-fat quark | 200 g as sold | 24.60 g | 134.00 kcal |
Here the quark portion nearly matches the soy portion in absolute protein although their per-100-g protein numbers differ greatly. The oats remain valuable as a grain and fibre-containing food, but a 50-g dry bowl supplies only 7 g protein before milk or toppings. Lentils contribute meaningful protein and other nutrients, yet the dry 75-g portion also supplies more energy than the dry 50-g soy portion.
If 200 g quark is too much, choose a smaller portion and recalculate. A 150-g portion gives 18.45 g protein and 100.5 kcal using this label. Serving size is not a contest where every food must have an equal gram weight; it is the amount you actually plan to eat. See portion size versus serving size for the underlying distinction.
Hydration: why cooked grams change while protein totals do not simply vanish
Suppose the 50 g oats become 175 g porridge with water; 75 g lentils become 190 g cooked lentils; and 50 g soy pieces become 155 g after soaking and draining. These are hypothetical kitchen yields to teach the calculation, not tested manufacturer yields or guarantees. For this simplified model only, we assume the starting protein and calories remain in the edible batch, with no meaningful cooking loss or calorie-containing additions.
| Food and assumed final state | Final weight | Protein per 100 g finished | Energy per 100 g finished |
|---|---|---|---|
| Oats + water | 175 g | 4.00 g | 106.29 kcal |
| Lentils cooked in water | 190 g | 10.26 g | 134.61 kcal |
| Soy hydrated with water | 155 g | 16.77 g | 119.68 kcal |
| Quark, unchanged | 200 g | 12.30 g | 67.00 kcal |
For lentils, 19.5 g starting protein ÷ 190 g final cooked weight × 100 = 10.26 g per 100 g cooked. Yet the whole pot portion still contains 19.5 g in the simplified model. Comparing the 26-g dry-label number directly with 10.26-g finished number confuses concentration with total nutrient amount. For a related explanation on grain preparation, see the dry-versus-cooked oat guide.
In real kitchens, some material transfers to discarded cooking water, foods can stick to cookware, and sauces add nutrients. Record the dry ingredient amount whenever practical, then measure final edible yield if you need per-100-g cooked values. Different cooking times and water volumes mean no universal cooked multiplier.
Per 100 kcal: a useful lens with important blind spots
Protein per 100 kcal answers, “How much label protein can I obtain for an equal energy allowance?” This is especially useful when comparing lean dairy foods and a concentrated ingredient under a fixed calorie budget. In this four-product set, quark ranks first at 18.36 g/100 kcal, followed by dry soy at 14.02, dry lentils at 7.62, and dry oats at 3.76.
But do not conclude that oats are poor food or that everyone should eat nothing but quark. A food offers more than protein. Oats and lentils also contribute fibre, carbohydrates and other nutrients. Quark provides dairy protein but not the fibre that lentils or oats supply. Allergens and dietary patterns matter, too: these examples include dairy, soy and oats.
Importantly, adding plain water to oats or soy changes protein per 100 g, not protein per 100 kcal in the loss-free illustration, because the numerator and energy denominator are both unchanged. Adding oil, sugar, milk or sauce really changes the calorie denominator and may alter protein density substantially.
A concrete target: what delivers approximately 20 g of protein?
One practical way to check a claim is to work backwards: grams required = target protein × 100 ÷ label protein per 100 g. For an illustrative 20 g protein target, the calculation gives these approximate amounts before additions.
| Product | Required labelled weight | Approximate energy | Interpretation |
|---|---|---|---|
| Rolled oats, dry | 142.86 g | 531.43 kcal | Unusually large dry oat portion for many breakfasts |
| Red lentils, dry | 76.92 g | 262.31 kcal | A substantive lentil component, cooked yield varies |
| Textured soy, dry | 38.46 g | 142.69 kcal | Needs hydration and thorough cooking |
| Low-fat quark | 162.60 g | 108.94 kcal | Ready-to-eat dairy, check lactose tolerance |
This table does not suggest eating dry soy or dry lentils. The weights specify how much dry ingredient to start with before preparation. For soy pieces the dmBio instructions call for hydration and thorough cooking. The 20-g reference is merely a mathematical target, not a universal single-meal prescription.
A meal with smaller portions of two or three foods can reach the same target. The best combination is the one that fits taste, cost, allergies, fibre and the rest of the day. If your objective is specifically protein per euro, calculate that separately; protein per 100 kcal is not a price comparison.
How toppings and sauces change the denominator
Consider 50 g of dry oats: the starting 7 g protein and 186 kcal do not describe the final breakfast once you add milk, yogurt, seeds or sweetened toppings. A protein-containing dairy addition raises both protein and energy. Nut butter may raise energy faster than protein. Neither outcome is intrinsically wrong; the unit should represent the finished bowl if you are comparing prepared meals.
For a soy-based dinner, oil, vegetables and sauce matter in a similar way. Comparing 50 g plain dry soy with a large seasoned lentil curry is not an apples-to-apples protein-efficiency test. Either compare ingredient to ingredient, or calculate complete recipes to the same criteria.
Beware of online rankings based on “one cup” without specifying cooked weight, drained weight or packing. Cups measure volume and two ingredients may occupy very different masses. For individual food energy pages, see the lentils reference, which keeps dry and cooked forms separate.
Reading packaging when the serving column differs
Start with three questions: What food state does the label describe? How much will I actually use? Am I comparing ingredients or finished meals? In the EU, a nutrition table with values per 100 g gives a stable basis; a second manufacturer-declared portion may help, provided you check the indicated grams. Fibre is not universally part of the mandatory EU nutrition panel even though it often appears voluntarily.
Do not assume a front-of-pack “protein” statement is sufficient evidence that the product meets your particular need. Check the amount, the ingredients and whether the panel describes dry, prepared or as-sold food. A product with a high percentage of calories from protein might still yield little protein in a tiny customary serving.
For packaged soup, check whether the table is for powder or soup “as prepared.” For canned beans, read whether 100 g refers to drained edible contents or a liquid-inclusive net weight. For fermented dairy, product type and added flavouring can make different brands unlike the plain quark example.
Quantity is not protein quality—and neither is cost
These numerical ratios cannot tell you how much of each indispensable amino acid is available after digestion. Different protein sources have different amino-acid patterns and digestibility. The DGE explains why total grams and protein quality are distinct considerations in its protein FAQ. Mealisa also has a focused explanation of protein digestibility and quality.
Price is a separate calculation: euros per 10 g protein = cost of the amount used × 10 ÷ grams of protein in that amount. If you are comparing shelf prices, first convert both products to a common edible basis; do not treat a heavy water-rich product as more expensive simply because its per-100-g protein concentration is lower. Keep package leftovers separate from ingredient cost.
Be cautious about turning density scores into personalized medical recommendations. Protein requirements differ with age, body size, pregnancy, illness and clinical circumstances. DGE reference values are population guidance rather than a target for every individual or meal.
Three quick shopping scenarios
Choosing between two plain skyr or quark cartons: compare protein and energy per 100 g first, then calculate the amount you will actually eat and its price. Hydration is irrelevant because both foods are sold ready to eat.
Choosing dry lentils versus dry soy for dinner: start with label values per dry 100 g, then choose realistic dry gram amounts. Hydrate or cook both, count oil and sauces, and use the actual cooked yield only if you need nutrition per cooked weight.
Choosing a breakfast under a specific energy allowance: compare the finished options by protein per 100 kcal, then ensure the portions are appealing and adequate. A bowl of oats with milk and fruit can be a reasonable breakfast even if plain quark leads a narrow protein-density ranking.
Conclusion: choose the denominator that answers your question
The most useful protein figure is not always the largest number on the label. Per 100 g makes like-for-like package comparisons convenient; per portion tells you what you will eat; per 100 kcal shows energy-adjusted protein density. Check dry versus cooked states, count added ingredients and keep protein quality and price as separate dimensions.
Our worked example illustrates this precisely: dry soy leads per 100 g (52 g protein), while low-fat quark leads per 100 kcal (18.36 g) and gives 24.6 g in a practical 200-g portion. Those conclusions can all be true simultaneously.
Sources
- dmBio rolled oats: product nutrition per 100 g.
- dmBio red lentils: dry-product nutrition per 100 g.
- dmBio textured soy: dry-product nutrition and cooking directions.
- ja! low-fat quark: product nutrition per 100 g.
- European Commission: nutrition labelling overview.
- EUR-Lex: Regulation (EU) No 1169/2011.
- DGE: protein and indispensable amino acids FAQ.