
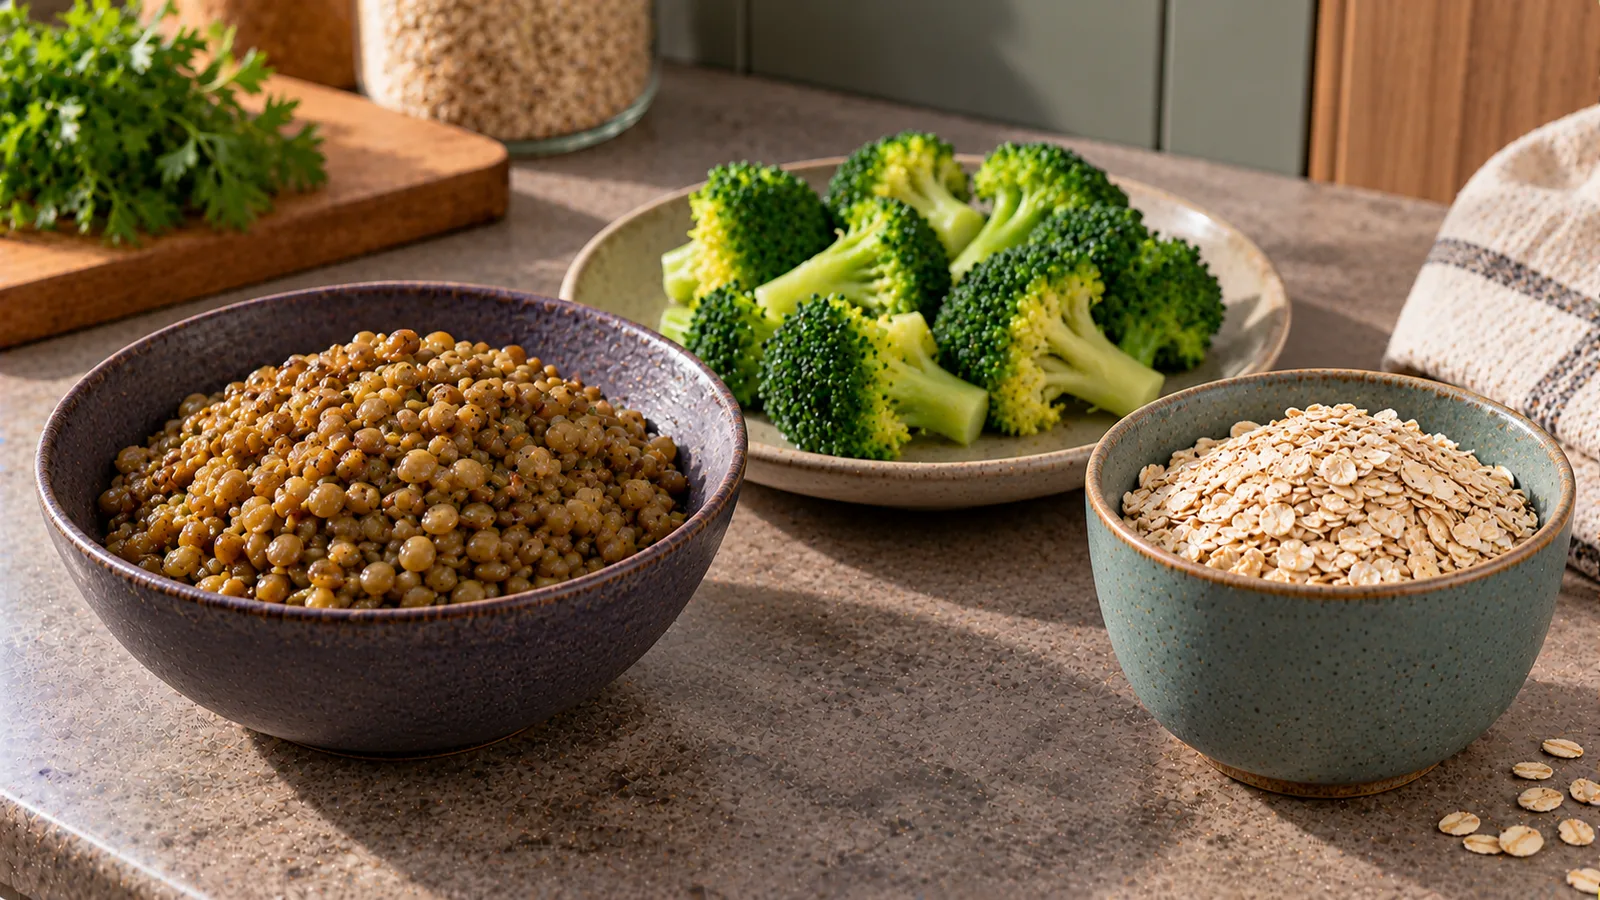
A food can rank first for fibre per 100 calories yet be beaten by another food in fibre per realistic serving. This is not a contradiction. Fibre per 100 kcal answers how much fibre comes with a given energy allowance, whereas fibre per portion answers what a quantity you actually eat delivers. A third number, fibre per 100 g, is useful for comparing labels by weight. None of these units alone measures the quality of an entire meal.
Consider three reference foods from the US Dietary Guidelines' historical food-source table. Raspberries provide 6.5 g fibre and 52 kcal per 100 g, so their energy-normalised figure is 12.5 g per 100 kcal. Cooked lentils provide 7.9 g per 116 kcal, or 6.8 g per 100 kcal. Almonds provide 12.5 g per 579 kcal, or only 2.2 g per 100 kcal. Yet a published half-cup serving of lentils supplies 7.8 g fibre, compared with 4.0 g from half a cup of raspberries. The denominator, not a mistake, changes the order.
The numerical examples in this guide come from the historical US Dietary Guidelines 2015–2020, Appendix 13, Table A13-1. They are reference foods, not nutrition labels for every brand sold today. Calculations below are independently derived from that table and rounded; its published reference portions should not be confused with a prescribed amount to eat.
The three units, without mixing their meanings
Per 100 g fixes the food's mass. It helps compare supermarket labels, provided both products are measured in the same state: two cooked foods, for instance, rather than one dry grain and one hydrated grain. Per 100 kcal fixes the energy and is calculated by dividing fibre per 100 g by calories per 100 g, then multiplying by 100. Per portion uses the grams, slices or cups in the amount eaten and records the actual fibre contribution.
For the first two units the food has not changed; only the denominator has. For the third, the food quantity changes. A bowl of cooked legumes can deliver substantial fibre even if another food has a larger fibre density per calorie. A small spoonful of seeds can have impressive values per 100 g while contributing much less in a normal topping portion.
There is no generally accepted 'best serving' applicable to every food. Portion size can depend on hunger, recipe, calorie needs and the rest of the meal. See Mealisa's explanation of portion size versus serving size if a manufacturer's suggested serving does not match what is on your plate.
Ranking foods by fibre per 100 kcal
The following calculation uses nine precisely identified food forms. Everything on this list is an edible food in the named preparation state. Dry chia seeds must not be compared using the cooked-lentil weight as though water content were equal. Values in the last column are calculated from the two columns immediately to the left and rounded to one decimal.
| Food / preparation | kcal/100 g | Fibre/100 g | Fibre/100 kcal |
|---|---|---|---|
| Raspberries | 52 | 6.5 | 12.5 |
| Navy beans, cooked | 140 | 10.5 | 7.5 |
| Chia seeds, dry | 486 | 34.4 | 7.1 |
| Plain rye wafer crackers | 334 | 22.9 | 6.9 |
| Lentils, cooked | 116 | 7.9 | 6.8 |
| Bulgur, cooked | 83 | 4.5 | 5.4 |
| Apple with skin | 52 | 2.4 | 4.6 |
| Air-popped popcorn | 387 | 14.5 | 3.7 |
| Almonds | 579 | 12.5 | 2.2 |
Raspberries lead this selection by fibre per unit of energy, but that does not mean they provide the most fibre in every meal. The little energy in a modest serving explains why their fibre-to-calorie ratio is high. The same arithmetic makes almonds, which also contain substantial fat and energy, rank much lower by this specific measure. Their protein, unsaturated fat and other nutrients have not been evaluated by this table.
This is a comparison among these nine foods, not a universal ranking of all foods. Other cultivars, recipes and branded products may contain different amounts. The table intentionally includes mixed food types to make the denominator visible, not to suggest a bowl of lentils is interchangeable with a fruit portion.
The same foods ranked by the fibre in a usual portion
Now sort the same nine entries, but use the separate USDA/HHS standard-portion numbers. Their portion sizes are not equal in grams or energy, and that is the point: people normally eat a few crackers, not 100 g of crackers, and perhaps an apple rather than 100 g of apple slices.
| Food / preparation | Reference portion | Portion kcal | Portion fibre |
|---|---|---|---|
| Navy beans, cooked | ½ cup | 127 | 9.6 |
| Lentils, cooked | ½ cup | 115 | 7.8 |
| Plain rye wafer crackers | 2 wafers | 73 | 5.0 |
| Apple with skin | 1 medium | 95 | 4.4 |
| Chia seeds, dry | 1 tbsp | 58 | 4.1 |
| Bulgur, cooked | ½ cup | 76 | 4.1 |
| Raspberries | ½ cup | 32 | 4.0 |
| Air-popped popcorn | 3 cups | 93 | 3.5 |
| Almonds | 1 oz (28 g) | 164 | 3.5 |
Cooked navy beans move to the top of this serving-based list at 9.6 g per half cup. A half cup of lentils supplies 7.8 g. Raspberries, despite leading the energy-normalised table, supply 4.0 g per half cup. This is a genuine reversal in how to answer the shopper's question, but not a verdict that beans are 'better' than berries. Beans can contribute to a main meal, while berries often accompany breakfast or dessert.
The portions and the per-100-g values were each rounded when published. For that reason, do not reverse-engineer precise gram weights from the portion calories and fibre or demand exact agreement to additional decimal places. If you have measured your own food in grams, the per-100-g calculation below is usually more useful than applying a historical cup measure.
Calculate a portion weighed on a kitchen scale
A general formula is fibre eaten (g) = edible weight (g) × fibre per 100 g ÷ 100. For calories, replace fibre per 100 g with calories per 100 g. In a real meal, add the quantities of separate foods after accounting for the recipe's cooking state.
| Food at this weight | Calculation | Fibre | Energy |
|---|---|---|---|
| Raspberries — 150 g | 150/100 × 6.5 g | 9.75 g | 78.0 kcal |
| Lentils, cooked — 150 g | 150/100 × 7.9 g | 11.85 g | 174.0 kcal |
| Almonds — 30 g | 30/100 × 12.5 g | 3.75 g | 173.7 kcal |
The 150 g raspberries in this illustration contribute 9.75 g fibre and 78 kcal. A 150 g cooked-lentil portion contributes 11.85 g fibre and 174 kcal. Thirty grams of almonds contribute 3.75 g fibre and 173.7 kcal. The lentils give more absolute fibre than the berries at these selected weights, even though the berries have the higher fibre-per-100-kcal ranking.
These three individual calculations are demonstrations of measurement, not a recommended snack or a complete day of eating. They do not add butter, oil, sauce, sugar or any other food. A household recipe needs those ingredients logged too if you want its energy total.
What happens when you equalise calories instead?
To compare like-for-like 100 kcal portions, the required food mass is `100 × 100 ÷ kcal per 100 g`. This means about 192 g of raspberries, 86 g of cooked lentils or just 17 g of almonds for 100 kcal based on these reference entries. The fibre delivered is approximately 12.5 g, 6.8 g and 2.2 g, respectively.
Those are mathematically equal-energy quantities, not necessarily sensible real-world portions. A bowl of almost 200 g of berries and a handful smaller than 20 g of almonds differ in volume, texture, protein, fats and convenience. Fibre per calorie is a useful lens when meal energy is constrained, but it cannot reliably predict which choice leaves someone fuller or which food belongs in their diet.
Do not silently replace a cooked 100 g reference with a dry 100 g reference. Boiling grains or beans changes water content, making their nutrition per 100 g of finished product very different even where much of the nutrient amount in the original ingredients remains. Match the state in the food database to the state on the scale.
The EU 'source of fibre' and 'high fibre' claims
European labelling rules explicitly recognise that fibre can be expressed by weight or by energy. Under the European Commission's nutrition-claims conditions, 'source of fibre' requires at least 3 g/100 g or 1.5 g/100 kcal, while 'high fibre' requires at least 6 g/100 g or 3 g/100 kcal. The conditions are alternatives; you should not treat them as two simultaneous thresholds for the same claim.
The thresholds govern authorised claims on appropriately labelled products. They are not a ranking of how filling a food is, nor a promise that a single serving makes a diet adequately high in fibre. A product can qualify by its nutrient density and still provide only a small number of grams in the quantity someone actually consumes. Always read the declared figure and the real pack portion together.
These claims must not be confused with claims that an ingredient treats gastrointestinal disease or reduces disease risk. A nutritional threshold does not establish those effects. For a wider review of high-fibre food choices, use foods and meals rather than a front-of-pack badge as the starting point.
A daily target needs total grams, not a leaderboard
For adults, EFSA considers 25 g fibre per day adequate for normal bowel function, while noting evidence of benefits with higher intakes in some contexts. This is a population reference, not a personal medical prescription. The EFSA dietary reference statement describes the reasoning.
A diet made of several moderate fibre contributors can be more practical than chasing the highest ranked item. For example, a normal meal with legumes, some fruit and a grain can accumulate fibre across different foods. The useful number for a daily tracker is the sum of grams consumed, not an average of each food's fibre-per-100-kcal ranking.
If you specifically want a worked whole-day menu with shopping costs and portion totals, Mealisa's worked 30 g fibre day answers that separate planning question. This article instead explains which comparison unit to select before adding numbers together.
A rapid rise in fibre intake can cause bloating or discomfort in some people. Increase changes gradually according to tolerance, include adequate fluids and seek individual clinical advice if you have symptoms or a condition requiring dietary restrictions. More fibre per calorie should not become a contest that overrides total food intake or comfort.
Choose a comparison unit for the decision you are making
Use per 100 g when comparing two packages for the same food state. Use per 100 kcal when you want to examine how much fibre comes with an equal energy allowance; it is especially revealing for berries, vegetables, nuts and seeds with very different energy densities. Use per weighed portion when you want to know what reached your plate or food diary.
A final practical check: read the whole nutrition panel for protein, energy and fat; note whether a grain is raw or cooked, whether beans are drained, and whether cereal or crackers contain added ingredients. Fibre is just one important measure in a balanced food choice.
For a separate budget decision, see protein and fibre per euro when shopping, which compares nutrients per euro; currency is a fourth denominator and must not be mistaken for calories or portion size.
Sources and calculation notes
- US Dietary Guidelines for Americans, 2015–2020, Appendix 13, Table A13-1. Historical reference values per 100 g and in standard food portions; nine selected foods from the table. All per-100-kcal and weighed-portion results above are derived arithmetic, not a separate set of lab tests.
- European Commission: authorised nutrition claims for fibre. EU nutrition-claim thresholds for 'source of fibre' and 'high fibre'.
- EFSA: dietary reference values for fibre. Adequate intake for normal bowel function in adults.
US household measures are included only as originally defined in the source. A real weighed portion and its product label should take priority when you are logging your own food.