
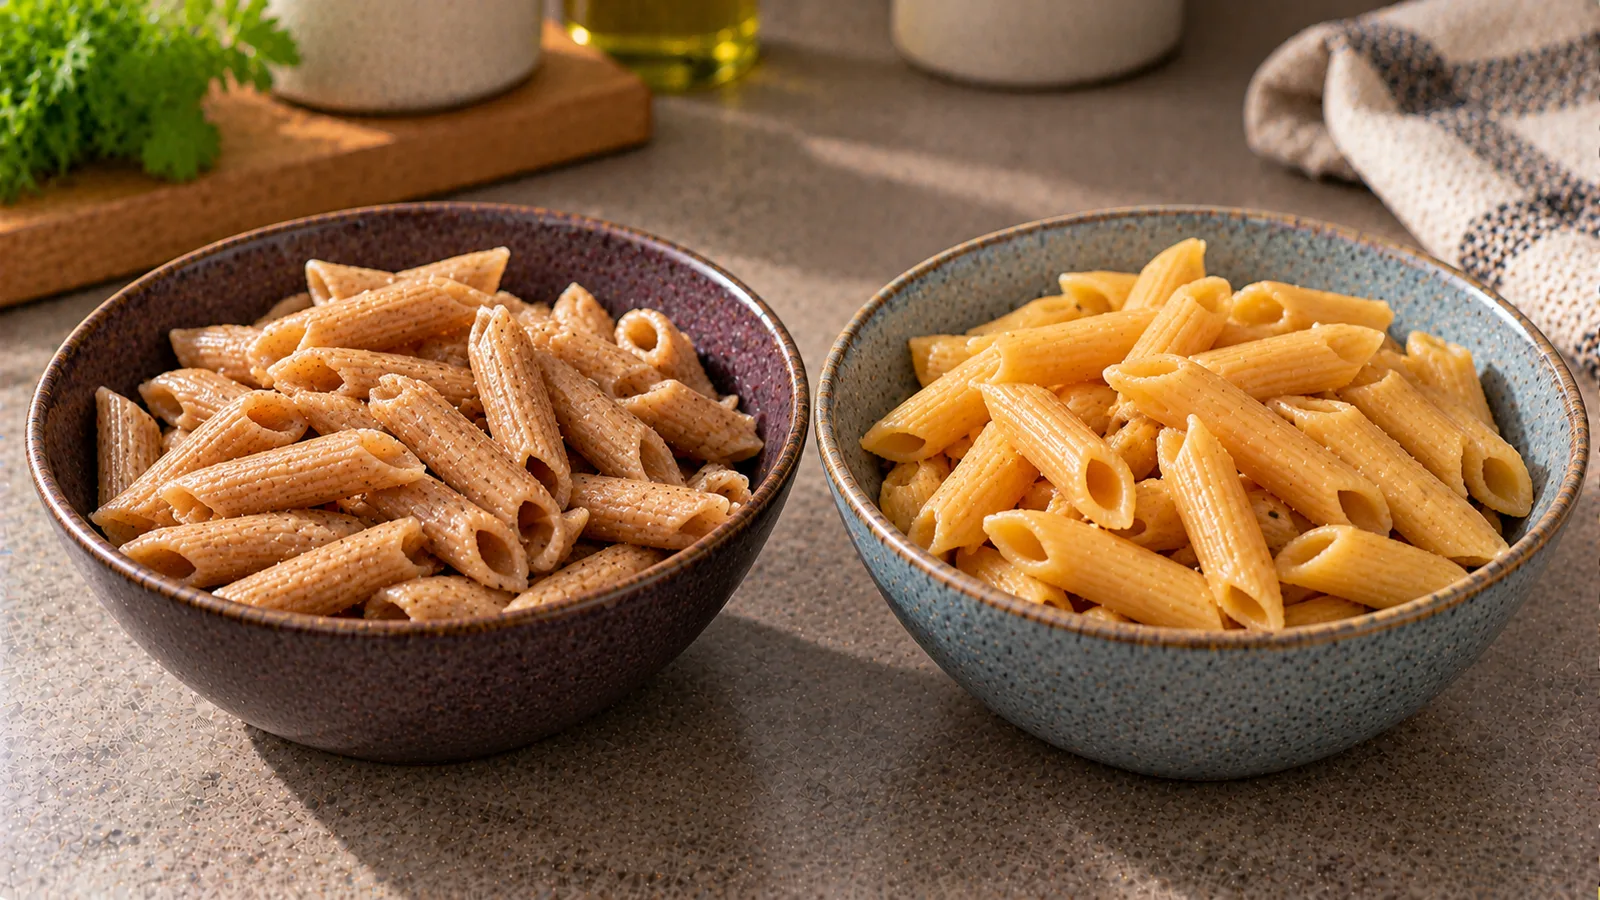
Wholegrain pasta and chickpea pasta can look almost interchangeable on a plate, but their ingredients, protein, fibre and price differ substantially. The fairest comparison starts with the dry weight on the package, then considers what happens when the pasta absorbs water. Otherwise a comparison of 100 g cooked pasta can confuse a recipe's water uptake with its actual nutritional advantage.
For a concrete example, this guide compares two products from the same manufacturer: Barilla Spaghetti Integrale, made from wholegrain durum wheat, and Barilla Chickpea Casarecce, made from chickpea flour. Their German product pages provide comparable values per 100 g of dry pasta: wholegrain spaghetti and chickpea casarecce. The illustrative prices and cooked yields below are assumptions, not current shop quotations or manufacturer yield specifications.
The nutrition labels: 100 g dry versus 100 g dry
| Per 100 g, uncooked | Wholegrain wheat pasta | Chickpea pasta |
|---|---|---|
| Energy | 350 kcal | 348 kcal |
| Protein | 13 g | 21 g |
| Fibre | 8 g | 14 g |
| Carbohydrate | 65.7 g | 45.1 g |
| Fat | 2.5 g | 6.2 g |
| Salt, before cooking | 0.013 g | 0.012 g |
The chickpea example provides 8 g more protein and 6 g more fibre per 100 g dry. That is a meaningful difference, but it is not an eight-gram improvement in every bowl: portions vary. Energy is nearly identical. Chickpea pasta is higher in fat, mainly because its raw ingredient differs, although it remains a relatively low-fat base compared with a pasta dish finished with oil and cheese.
The carbohydrate figures are those on the European-style label; fibre is displayed separately. Do not calculate calories by adding the carbohydrate and fibre numbers as if they were identical measures. Labels round values, and different countries can use different conventions. Likewise, both products have little salt before you add salted cooking water, sauce or toppings.
These are two product labels, not a guarantee that every legume pasta wins every category. Some chickpea pasta contains rice flour or other ingredients, while wholegrain formulations differ in fibre and protein. Check your specific package.
A practical portion: 75 g dry pasta
A 75 g dry portion is a convenient worked example, not a prescription for everyone. Multiply each 100 g value by 0.75. The same calculation works for 60 g or 100 g: dry quantity divided by 100, times the printed nutrient figure.
| One 75 g dry portion | Wholegrain wheat | Chickpea |
|---|---|---|
| Energy | 262.5 kcal | 261 kcal |
| Protein | 9.75 g | 15.75 g |
| Fibre | 6 g | 10.5 g |
| Carbohydrate | 49.28 g | 33.83 g |
| Illustrative pasta cost | €0.27 | €0.84 |
The extra 6 g protein in the chickpea portion can make a vegetarian meal easier to build, especially when the sauce itself is relatively light. But the wheat pasta still contributes nearly 10 g of protein before toppings. Neither pasta by itself provides all the vegetables, flavours and dietary variety of a balanced meal.
The extra 4.5 g fibre in the chickpea portion may be helpful when daily intake is low. It is not the same as saying the food will automatically keep every person fuller for longer: satiety also depends on the meal's volume, water, fat, protein, individual tolerance and eating context. The German Nutrition Society's fibre guidance identifies both pulses and wholegrains as useful fibre sources. For more everyday food choices, see Mealisa's high-fibre foods guide.
Why an equal cooked-weight comparison is different
Dry pasta absorbs water. A heavier finished portion can contain exactly the same dry ingredients as a lighter portion of another shape if their water uptake differs. Manufacturers do not provide one universal cooked yield for all brands, shapes, cooking times and preferences.
To make the arithmetic visible, imagine a kitchen test in which 75 g wholegrain pasta becomes 180 g cooked (a yield factor of 2.4) while 75 g chickpea pasta becomes 165 g cooked (a factor of 2.2). These are hypothetical measured yields for teaching the method, not published values for the two Barilla products. Your own results may reverse or narrow that difference.
If you weigh the same 180 g on the plate, the dry pasta represented is 75 g wheat versus about 81.82 g chickpea. That changes the comparison:
| Hypothetical 180 g cooked serving | Wholegrain wheat | Chickpea |
|---|---|---|
| Dry pasta represented | 75 g | 81.82 g |
| Energy, estimated from dry label | 262.5 kcal | 284.7 kcal |
| Protein, estimated | 9.75 g | 17.18 g |
| Fibre, estimated | 6 g | 11.45 g |
| Illustrative pasta cost | €0.27 | €0.91 |
These are label-based estimates: they treat dry-labelled nutrients as approximately retained in the cooked pasta and ignore small cooking losses and nutrient transfer into drained water. For a real comparison, weigh your dry quantity and cooked yield, record both, and use the label to calculate nutrients from the dry starting weight. Dividing label nutrients by your observed cooked yield can then give an approximate per-100-g cooked value for your batch.
Example: 75 g dry chickpea pasta has 15.75 g protein according to the example label. If it becomes 165 g cooked, that is approximately 9.55 g protein per 100 g cooked, not 21 g. The 21 g figure belongs to 100 g dry pasta. This distinction is particularly important when entering food into a calorie-tracking app. Never log 180 g cooked as 180 g dry.
Cost comparison: checkout, dry portion and protein
Nutrition is only one side of the purchase. To explain the price calculation without pretending to know your local shelf price, assume €1.79 for 500 g wholegrain wheat pasta and €2.79 for 250 g chickpea pasta. These figures are illustrative German shopping scenarios, not verified Barilla or retailer prices. Replace them with the actual amounts on your receipt.
| Illustrative cost metric | Wholegrain wheat | Chickpea |
|---|---|---|
| Package size | 500 g | 250 g |
| Example package price | €1.79 | €2.79 |
| Price per kg dry | €3.58 | €11.16 |
| 75 g dry pasta used | €0.27 | €0.84 |
| Pasta cost per 10 g label protein | €0.28 | €0.53 |
To get the last row, divide the price per 100 g by the grams of protein per 100 g, then multiply by 10. It measures how much the pasta itself costs to supply 10 g of labelled protein; it does not measure protein quality or the cost of a complete dinner. On this assumed price pair, chickpea pasta costs about 3.1 times as much per dry 75 g, despite providing about 1.6 times the protein.
There is also a difference between checkout spend and ingredients used. Four dry 75 g portions require 300 g. One 500 g wheat pack costs €1.79 and leaves 200 g; two 250 g chickpea packs cost €5.58 and leave 200 g. Yet the pasta actually used in those four meals costs approximately €1.07 versus €3.35 at the illustrative unit prices. The unused 200 g is pantry stock, not waste or a free ingredient.
The most useful next comparison is the total dish, not merely the pasta. A cheap wholegrain pasta with a bean-and-tomato sauce might offer enough protein and fibre at a lower overall price. On the other hand, chickpea pasta can simplify a light vegetable dinner by contributing more protein without a separate legume topping. If your priority is affordability rather than a particular pasta ingredient, read the protein and fibre per euro guide as well.
Two equal-effort dinners using the same sauce
Consider the same sauce for both bases: tomatoes, garlic, spinach and a little olive oil. Cook 75 g dry pasta per person and serve it with approximately 200–250 g vegetables and sauce. Keeping the sauce and portion identical lets you isolate what changing the pasta does. The pasta-only difference is the 6 g protein and 4.5 g fibre already calculated above; the sauce adds nutrients to both meals and should be counted from its own ingredients.
For a wholegrain pasta dinner, a spoonful of white beans, lentils, grated hard cheese or tofu can raise the protein without abandoning the cheaper base. For a chickpea pasta dinner, the legume flour already supplies a larger portion of the protein; a vegetable-rich sauce may be sufficient depending on the rest of your day. Neither arrangement is nutritionally mandatory. Choose according to your actual meal, preferences and budget.
A third strategy is to combine the two dry pastas in one meal. At 37.5 g of each, the pasta contributes about 12.75 g protein and 8.25 g fibre before sauce, with a dry ingredient cost of roughly €0.55 under the same hypothetical pricing. This is a budgeting option only when you have both products and the shapes cook compatibly. Different cooking times mean they may need separate pots or staggered addition.
A comparison with protein-fortified wheat pasta is a different question. Some products boost protein by adding pea protein to a wheat base; this article deliberately compares wholegrain wheat with 100% chickpea-flour pasta. Ingredient lists matter more than the word “protein” on a front label. For that separate product category, see Mealisa's protein-enriched versus regular pasta comparison.
Taste, cooking and ingredients matter
Wholegrain pasta usually offers a wheaty, somewhat nutty taste and a familiar elastic bite. Chickpea pasta often tastes more distinctly of pulses and can become soft or split if cooked too long. These are typical sensory differences, not objective defects. Follow the time on your package: the two example product pages list different suggested timings. Start tasting near the lower end, stir gently and drain when the texture suits the sauce.
Wholegrain spaghetti contains wheat, so it is not appropriate for a person who must avoid gluten. The cited chickpea product is marketed as gluten-free, but anyone with coeliac disease should check the label of the specific package and avoid cross-contact during preparation. Chickpea pasta is not suitable for everyone either: some people notice more gastrointestinal discomfort when they suddenly increase legume intake. Smaller portions and gradually increasing fibre can be easier to tolerate.
Watch how you season the finished food. A tablespoon of oil, pesto, cheese or a salty bottled sauce can affect energy and salt more than the approximately 1.5 kcal difference between the dry 75 g pasta portions. This is why swapping pasta alone should never be described as a guaranteed weight-loss intervention.
How to choose at the supermarket
Start with your actual goal. If it is more protein in the same dry portion, this particular chickpea pasta provides a clear increase. If it is more fibre, it also wins on the compared labels, although wholegrain pasta is already a useful fibre source. If it is lower pasta cost, the wholegrain example wins decisively at the assumed prices. If you avoid wheat for medical reasons, compare a suitably labelled gluten-free product rather than treating all legume-based pasta as automatically safe.
Next, turn the packs over. Compare their ingredients, protein and fibre per 100 g dry, then price per kilogram. For a fair plate-size comparison, weigh a typical portion both before and after cooking once. Do not compare a cooked food database entry with a dry package label. Also check serving sizes: a big protein number on the front may correspond to a 100 g dry serving that is larger than you normally use.
Finally, consider the meal around it. Vegetables, sauces and additions can make a greater difference to taste, satisfaction and total nutrition than the pasta category itself. A shopping decision is successful when the product fits the meal you actually want to cook and the budget you have, not when it wins an isolated table. For the broader distinction between a nutritional label and a useful meal, see how to build a balanced meal.
What the evidence does—and does not—tell us
The numerical comparisons above come from the Barilla wholegrain label and the Barilla chickpea label. They establish the label composition of those two uncooked products. They do not establish that one pasta automatically improves blood sugar, causes weight loss, or produces better long-term health outcomes in people.
The DGE recommendation to prefer wholegrains concerns dietary patterns, not a claim that wholegrain pasta always beats every pulse-based alternative. DGE also recommends legumes as regular components of a varied diet. Combining wholegrains and pulses over the week is entirely reasonable. The cooked yields and every euro value in the comparison tables are transparent worked assumptions, not measurements from a laboratory or price check.