
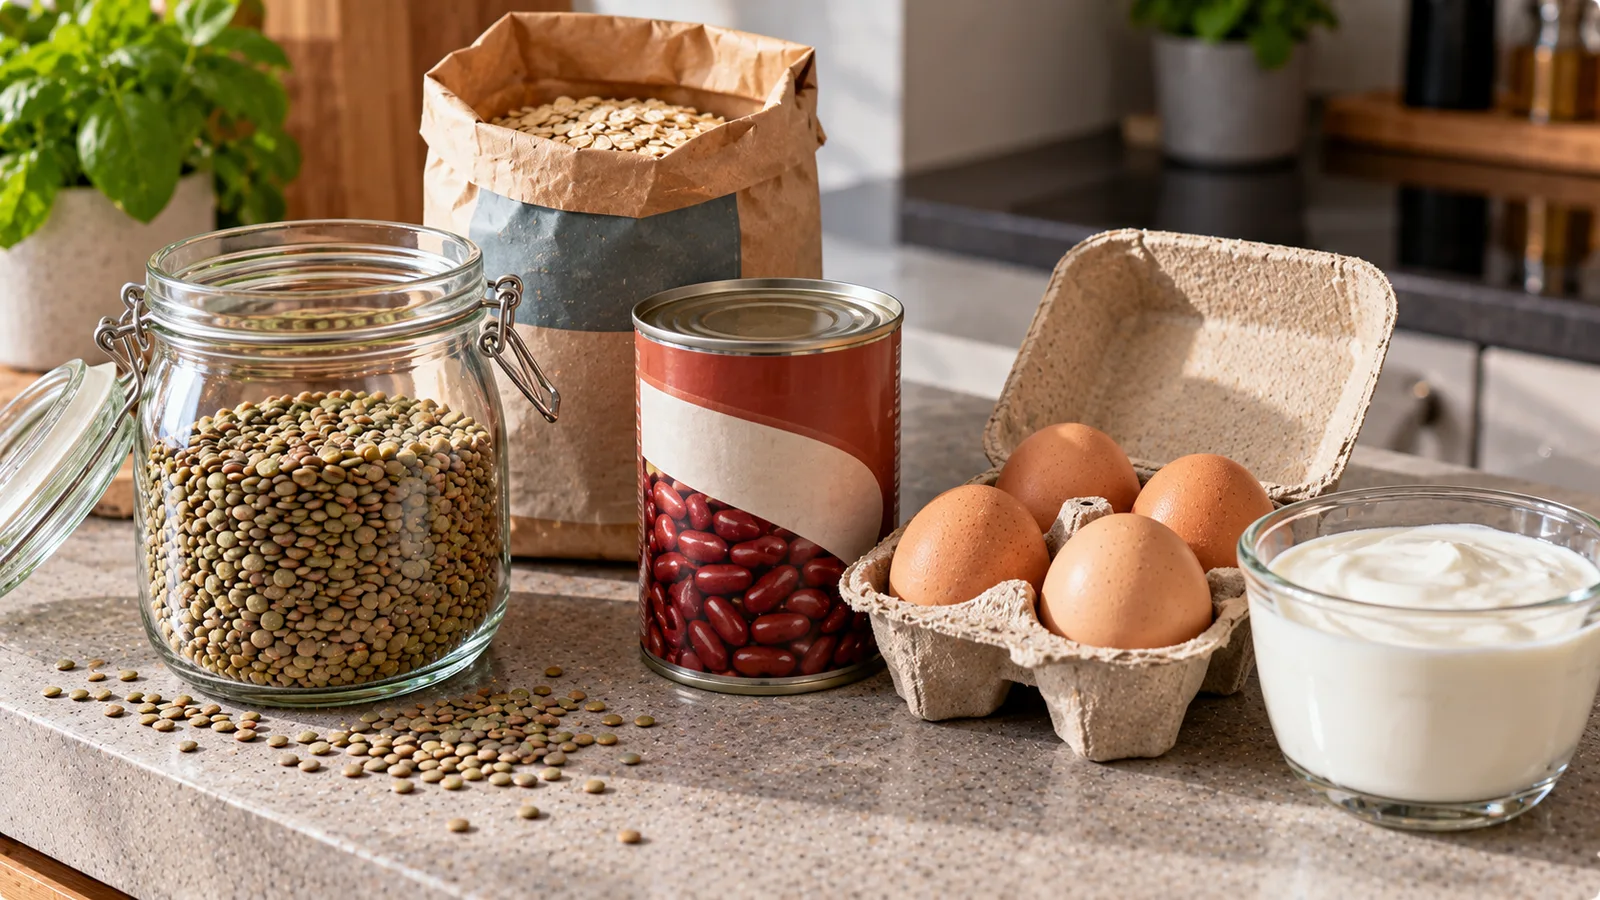
The cheapest food per kilogram is not necessarily the best value for your nutrition goals.
A bag of rice may be inexpensive, while a tub of yogurt or a package of lentils may provide more of the nutrients you are trying to include in your diet.
If you want to compare groceries more systematically, two useful measurements are grams of protein per euro and grams of dietary fiber per euro.
These measurements do not tell you which food is healthiest. They answer a narrower question: how much of a particular nutrient do you receive for the money spent?
The method works especially well when comparing similar foods, deciding between protein sources, or looking for affordable ways to increase dietary fiber.
Two useful grocery calculations
For protein:
Protein per euro = total grams of protein in the purchased food ÷ purchase price in euros.
For fiber:
Fiber per euro = total grams of fiber in the purchased food ÷ purchase price in euros.
If the nutrition label provides values per 100 g, calculate the total nutrient quantity first.
Total nutrient grams = nutrient grams per 100 g × edible purchased grams ÷ 100.
Then divide by the price.
For example, suppose a 500 g package costs €1.50 and contains 8 g protein per 100 g.
Total protein:
500 × 8 ÷ 100 = 40 g.
Protein per euro:
40 ÷ 1.50 = 26.7 g per €1.
This means the product provides approximately 26.7 g of protein for every euro spent, before accounting for any waste or unused portions.
A grocery comparison example
The following table uses illustrative German supermarket-style prices and rounded nutritional assumptions.
These are worked examples, not verified current retail prices or exact values for every brand. Check your own package labels and shelf prices before making a purchase.
| Product | Purchased quantity | Example price | Protein per 100 g | Fiber per 100 g |
|---|---|---|---|---|
| Dry red lentils | 500 g | €1.49 | 24 g | 11 g |
| Dry oats | 500 g | €0.89 | 13 g | 10 g |
| Canned chickpeas, drained | 240 g | €0.89 | 7 g | 6 g |
| Plain skyr | 500 g | €1.49 | 11 g | 0 g |
| Eggs, edible portion | 300 g | €1.79 | 13 g | 0 g |
| Frozen green peas | 750 g | €1.79 | 5 g | 5 g |
The protein and fiber figures are illustrative approximations. Real products vary, particularly canned legumes and products measured before or after cooking. For a specific comparison of legumes by protein, fibre and cooking cost, see chickpeas versus white beans.
For eggs, the example assumes 300 g of edible egg from a purchased pack, rather than treating the shell as food.
Protein per euro: the results
| Product | Total protein | Protein per €1 |
|---|---|---|
| Dry red lentils | 120 g | 80.5 g |
| Dry oats | 65 g | 73.0 g |
| Canned chickpeas, drained | 16.8 g | 18.9 g |
| Plain skyr | 55 g | 36.9 g |
| Eggs, edible portion | 39 g | 21.8 g |
| Frozen green peas | 37.5 g | 20.9 g |
For example, the lentil calculation is:
500 × 24 ÷ 100 = 120 g protein.
120 ÷ 1.49 = 80.5 g protein per euro.
Under these assumptions, dry lentils provide the most protein per euro among the listed products.
That does not mean lentils are interchangeable with skyr, eggs or other foods.
Protein quality, amino acid composition, preparation, digestibility, meal suitability and personal preferences also matter.
Fiber per euro: the results
| Product | Total fiber | Fiber per €1 |
|---|---|---|
| Dry red lentils | 55 g | 36.9 g |
| Dry oats | 50 g | 56.2 g |
| Canned chickpeas, drained | 14.4 g | 16.2 g |
| Plain skyr | 0 g | 0 g |
| Eggs, edible portion | 0 g | 0 g |
| Frozen green peas | 37.5 g | 20.9 g |
For oats:
500 × 10 ÷ 100 = 50 g fiber.
50 ÷ 0.89 = 56.2 g fiber per euro.
Under these illustrative assumptions, oats provide more fiber per euro than the other listed products.
But that does not mean a person should obtain all their fiber from oats.
A varied intake of whole grains, legumes, vegetables, fruit, nuts and seeds provides different nutrients and makes meals more interesting.
Why protein and fiber should not be combined into one score
It may be tempting to add protein grams and fiber grams together and rank every food using a single number.
For example:
Protein + fiber per euro.
This is mathematically possible, but it is not a validated measure of nutritional quality.
Protein and fiber have different physiological functions.
One gram of protein is not equivalent to one gram of fiber.
A food that provides 20 g protein and no fiber should not automatically be considered equivalent to one that provides 10 g protein and 10 g fiber.
A better approach is to keep the two measurements separate.
You can then choose products that match the specific gaps in your weekly meals.
The important distinction: price per kilogram versus nutrient value
Consider two hypothetical products.
Product A costs €2 per kilogram and provides 3 g protein per 100 g.
Product B costs €4 per kilogram and provides 12 g protein per 100 g.
Product A is cheaper by weight.
But for one kilogram:
Product A provides 30 g protein.
30 ÷ 2 = 15 g protein per euro.
Product B provides 120 g protein.
120 ÷ 4 = 30 g protein per euro.
Product B costs twice as much per kilogram but supplies twice as much protein per euro.
The cheaper kilogram is not always the cheaper nutrient.
Use the edible quantity, not just package weight
Package weight can be misleading.
For example, a can of chickpeas may contain 400 g in total but only around 240 g after draining.
If the nutrition information refers to drained chickpeas, the calculation should use the drained weight.
Using the entire 400 g would overstate the edible protein and fiber.
The same principle applies to foods with shells, bones, peels or other discarded parts.
For accurate comparisons, use the weight corresponding to the nutrition values.
Dry versus cooked lentils
Dry lentils absorb water during cooking.
This increases their weight without increasing the total amount of protein or fiber in the original dry quantity.
Suppose 100 g dry lentils contain approximately 24 g protein.
After cooking, the lentils might weigh considerably more because of absorbed water.
The original protein is distributed across the larger cooked weight, apart from possible preparation losses.
Do not compare the protein per 100 g of dry lentils directly with the protein per 100 g of cooked lentils without accounting for water.
For grocery value, using the purchased dry weight and dry-food nutrition label is often the simplest method.
For meal tracking, use either dry or cooked entries consistently.
Canned versus dry beans
Dry beans often look more economical on a nutrient-per-euro basis.
However, they require soaking or cooking, depending on the variety.
Canned beans are ready to use and can save time.
A fair comparison may include:
- Edible weight.
- Actual nutrient content.
- Purchase price.
- Cooking energy.
- Preparation time.
- Whether leftovers will be used.
If you routinely waste part of a large dry-bean package, the theoretical nutrient value does not reflect what you actually eat.
Convenience can also be worth paying for.
Protein per euro is not the same as protein quality
The grams-per-euro calculation counts total protein.
It does not account for differences in amino acid composition or digestibility.
Eggs, dairy, fish, meat, soy foods and legumes have different nutritional profiles.
For a varied diet, combine foods rather than relying exclusively on the cheapest source of protein.
If you follow a vegan diet, pay particular attention to overall dietary variety and nutrients that require deliberate planning, such as vitamin B12.
For background information on protein and amino acids, see the FAO report on dietary protein quality.
Fiber per euro is not the same as overall diet quality
A product may supply substantial fiber while also containing large amounts of added sugar or salt.
Similarly, some nutrient-rich foods provide little fiber.
Fiber per euro is useful for a specific shopping question, not as a complete nutritional ranking.
The World Health Organization's healthy diet guidance emphasizes dietary variety and foods such as vegetables, fruit, pulses and whole grains.
Use fiber-per-euro comparisons within that broader context.
Compare products within the same category first
The metric becomes more useful when comparing alternatives serving a similar role.
Examples include:
- Two brands of plain oats.
- Dry lentils versus canned lentils.
- Different types of beans.
- Two skyr products.
- Frozen peas versus another vegetable side.
This avoids comparing foods that serve completely different purposes.
For example, comparing a bag of oats directly with a bottle of olive oil using protein per euro is not meaningful for most shopping decisions.
How to compare two products on a shelf
Imagine two packages of dry lentils.
| Detail | Product A | Product B |
|---|---|---|
| Package weight | 500 g | 750 g |
| Price | €1.49 | €2.39 |
| Protein per 100 g | 24 g | 25 g |
| Fiber per 100 g | 11 g | 10 g |
Product A:
Protein: 500 × 24 ÷ 100 = 120 g.
Protein per euro: 120 ÷ 1.49 = 80.5 g.
Fiber: 500 × 11 ÷ 100 = 55 g.
Fiber per euro: 55 ÷ 1.49 = 36.9 g.
Product B:
Protein: 750 × 25 ÷ 100 = 187.5 g.
Protein per euro: 187.5 ÷ 2.39 = 78.5 g.
Fiber: 750 × 10 ÷ 100 = 75 g.
Fiber per euro: 75 ÷ 2.39 = 31.4 g.
Despite its larger package, Product B provides slightly less protein and fiber per euro under these assumptions.
The larger pack is not automatically the better deal.
A useful third measurement: cost per 10 g protein
Some shoppers find cost per nutrient target easier to understand.
The formula is:
Cost per 10 g protein = price ÷ total protein × 10.
For Product A lentils:
€1.49 ÷ 120 × 10 = approximately €0.12 per 10 g protein.
For the example skyr:
€1.49 ÷ 55 × 10 = approximately €0.27 per 10 g protein.
Both measurements describe the same relationship from different directions.
Protein per euro is useful for ranking products.
Cost per 10 g protein can be useful for budgeting.
Cost per 10 g fiber
The same approach works for fiber.
Cost per 10 g fiber = price ÷ total fiber × 10.
For the example oats:
€0.89 ÷ 50 × 10 = approximately €0.18 per 10 g fiber.
For the example frozen peas:
€1.79 ÷ 37.5 × 10 = approximately €0.48 per 10 g fiber.
These are calculations from the illustrative table, not live supermarket prices.
Avoid buying food you will not finish
A product can have an excellent nutrient-per-euro score and still be poor value if you throw much of it away.
Suppose you buy a 1 kg package but use only 600 g before the rest spoils.
Your effective cost per consumed gram of protein is higher than the theoretical calculation.
For foods with a short shelf life, consider realistic consumption.
For dry staples that store well, larger packages may be easier to use completely.
A practical comparison should consider the food you expect to eat, not merely the food you purchase.
Create a simple grocery scorecard
You can use a small table in a spreadsheet or note-taking app.
| Product | Price | Edible grams | Protein/100 g | Fiber/100 g | Protein/€ | Fiber/€ |
|---|---|---|---|---|---|---|
| Product A | Enter | Enter | Enter | Enter | Calculate | Calculate |
| Product B | Enter | Enter | Enter | Enter | Calculate | Calculate |
For each product:
Protein per euro = edible grams × protein per 100 g ÷ 100 ÷ price.
Fiber per euro = edible grams × fiber per 100 g ÷ 100 ÷ price.
Use the actual package and the current shelf price.
If the price changes, recalculate the score.
What if a product contains no fiber?
Foods such as eggs, fish and plain dairy products generally contain no dietary fiber.
Their fiber-per-euro score is therefore zero.
That does not make them nutritionally worthless.
It means they do not contribute to the particular nutrient being measured.
A weekly grocery basket can contain both protein-focused foods and fiber-focused foods.
The purpose is to cover your needs through a combination of products.
A realistic shopping strategy
Instead of searching for one perfect food, build a basket with complementary roles.
For example:
Protein-focused items: skyr, eggs, tofu, fish, poultry or legumes.
Fiber-focused items: oats, beans, lentils, whole grains, vegetables and fruit.
Flexible staples: rice, potatoes, pasta, oils and seasonings.
The exact mix depends on your diet, budget, preferences and cooking habits.
Compare nutrient value within each group, then make sure the full basket supports varied meals.
Five mistakes that distort the calculation
- Using package weight instead of drained or edible weight. This can overstate nutrient totals.
- Mixing dry and cooked nutrition values. Water changes nutrient concentration per 100 g.
- Ignoring the actual price. A promotional price may change the ranking.
- Treating protein and fiber as interchangeable. They measure different nutritional contributions.
- Ignoring food waste and preparation. The best theoretical value may not be the best practical choice.
Where to get reliable nutrient data
For packaged groceries, the product's nutrition label is the first place to look.
For unlabelled foods, established food composition databases can provide reference values.
Useful resources include:
- USDA FoodData Central for food composition data.
- German Federal Food Key information for the German food composition database.
- EU Regulation 1169/2011 for food information and labelling requirements.
Fiber definitions and carbohydrate declarations may differ between databases and labelling systems.
Use comparable values wherever possible.
The bottom line for grocery decisions
Protein per euro and fiber per euro are simple tools for comparing nutritional value against cost.
They can reveal differences that ordinary price-per-kilogram comparisons miss.
But they do not measure protein quality, dietary variety, taste, preparation time or food waste.
Use both metrics as part of a broader grocery decision.
The best-value basket is not necessarily the one with the highest score for a single nutrient. It is the one that provides useful nutrition, fits your meals and is actually eaten.