
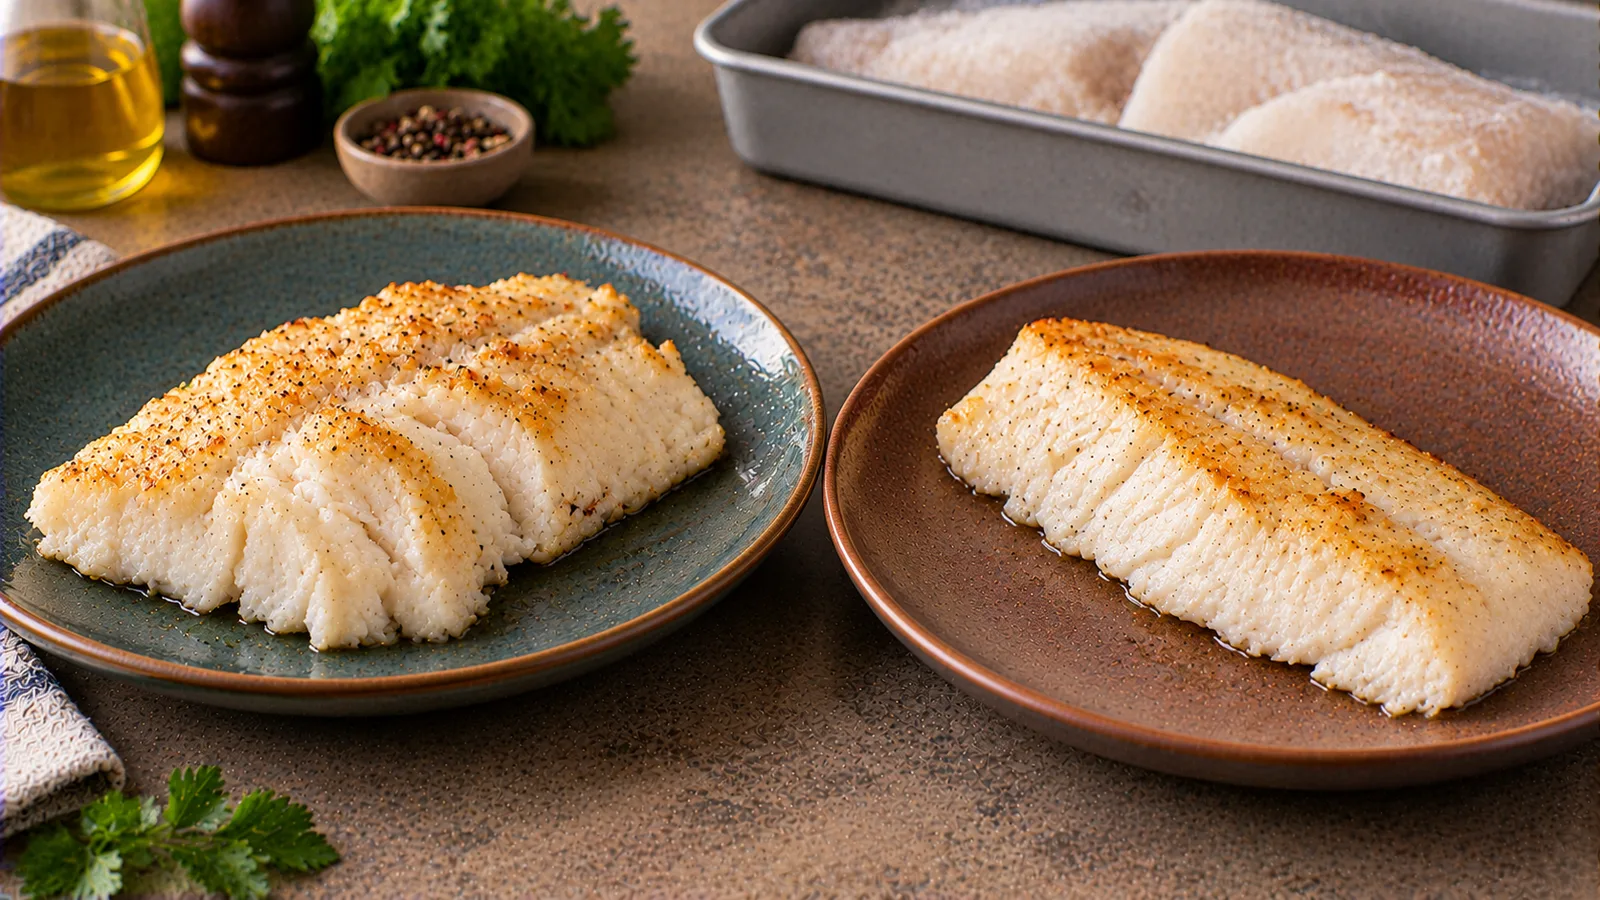
How much cod is a serving, and does haddock give more protein for the money? First choose a consistent weight. This comparison uses 150 g of plain, cooked, edible fillet on each plate, without skin, bones, breadcrumbs, oil or sauce. It then calculates how much raw, thawed fish a cook might need and what the fish portion would cost using clearly hypothetical frozen-fillet prices for Germany and France. A 150 g cooked portion is a comparison size, not a medical requirement or the only acceptable serving.
The central question differs from a general guide to cod calories and serving sizes or a generic analysis of whether frozen fish is cheaper per edible fillet than fresh fish. Here the two species are compared at the same cooked weight, with one explicitly defined USDA entry for each, and the shopping calculation goes back to raw edible weight. Do not interpret these data as nutrition claims for a breaded product, salted fish, a whole fish with bones, or every supermarket pack labelled “cod.”
Which cod and haddock are being compared?
Cod here means *Atlantic cod (Gadus morhua), plainly cooked by dry heat, from USDA FoodData Central SR Legacy FDC 171956. Haddock means plainly cooked haddock (Melanogrammus aeglefinus*) from USDA SR Legacy FDC 174198, also described as cooked by dry heat. Both entries are about cooked, edible fish, not the raw-weight nutrition declaration on a bag. An individual species, supplier, cut, retained water and cooking technique can produce a different result. Pacific cod, pollock, hake and fish fingers must not be silently substituted for these entries.
In the selected USDA entries, cooked Atlantic cod contains 22.8 g protein, 0.86 g fat and 105 kcal per 100 g, whereas cooked haddock contains 20.0 g protein, 0.55 g fat and 90 kcal per 100 g. Those are reference-composition values rounded to the level reported here. At 150 g, multiply each per-100-g figure by 1.5. A package label for a different product can disagree for valid reasons; prefer that label for your own food.
| Plain cooked edible fillet | Protein / 100 g | Protein / 150 g | Fat / 150 g | Energy / 150 g |
|---|---|---|---|---|
| Atlantic cod, USDA FDC 171956 | 22.8 g | 34.2 g | 1.29 g | 157.5 kcal |
| Haddock, USDA FDC 174198 | 20.0 g | 30.0 g | 0.825 g | 135 kcal |
On this specifically defined 150 g cooked basis, cod supplies 4.2 g more protein. It also carries approximately 22.5 kcal more and 0.465 g more fat in these records. These modest differences are not a reason to call either food “fattening” or “better for everyone.” Preparation, whole-plate composition, taste, price and availability usually matter more than such a small difference in fat.
Serving size is about the state of the fish
A fillet weighing 150 g frozen is not guaranteed to yield 150 g cooked. The bag may describe the net food weight and, for a glazed product, special declaration rules apply. Thawing can produce drip loss; skin or bones can be discarded; heating changes moisture. “Fish weight,” “usable raw fillet” and “edible cooked portion” are three different quantities. Do not mix them in one protein or cost calculation.
For this particular worked example, assume that a plain, boneless cod fillet retains 80% of its usable thawed raw weight after cooking, and a comparable haddock fillet retains 75%. Both percentages are illustrative assumptions, not verified species-wide cooking yields or numbers measured for the USDA samples. The USDA food-yield reference describes why preparation and trimming change weight; the figures here must be replaced by the result from your own cooking method if precision matters.
| Target: 150 g cooked edible fish | Assumed cooking yield | Usable thawed raw fillet required | Model cooking loss |
|---|---|---|---|
| Atlantic cod | 80% | 187.5 g | 37.5 g |
| Haddock | 75% | 200.0 g | 50.0 g |
The math is 150 ÷ 0.80 = 187.5 g raw cod and 150 ÷ 0.75 = 200.0 g raw haddock. This is not a conversion from package weight if ice glazing, removed bones, skin, added water or thawing drip further reduce edible fish. For that purchase-to-plate problem, first measure the usable thawed portion, then measure it again after cooking. Keep raw nutrition labels separate from cooked USDA tables; cooking removes water but does not create protein.
Two frozen-price scenarios, not a supermarket price survey
The following prices are invented examples, not observed prices, advertised offers or national averages for October 2026. They demonstrate how the same 150 g cooked portion can cost different amounts when the raw usable fillets have different kilogram prices and yields. Germany: assume €12.00/kg for cod and €10.00/kg for haddock. France: assume €15.00/kg for cod and €13.00/kg for haddock. These separate country scenarios are chosen only to make the arithmetic explicit; they do not imply that French stores are always more expensive or that both fish are easy to find in every chain.
| Illustrative market | Cod price / raw kg | Cod cost / 150 g cooked | Haddock price / raw kg | Haddock cost / 150 g cooked |
|---|---|---|---|---|
| Germany — hypothetical | €12.00 | €2.25 | €10.00 | €2.00 |
| France — hypothetical | €15.00 | €2.81 | €13.00 | €2.60 |
For Germany: 0.1875 kg × €12.00 = €2.25 for cod; 0.2000 kg × €10.00 = €2.00 for haddock. The haddock portion costs €0.25 less. For France: 0.1875 kg × €15.00 = €2.8125, displayed as €2.81; 0.2000 kg × €13.00 = €2.60. The cod portion costs about €0.21 more after rounding. These are ingredient-use costs. Buying a whole 400 g or 500 g bag at checkout means paying for the bag while leaving fish for another meal.
There is a counterintuitive finding in the German scenario: although cod costs more per 150 g cooked, its 34.2 g protein divided by €2.25 is 15.2 g protein per euro, versus 30.0 ÷ €2.00 = 15.0 g per euro for haddock. The slightly cheaper fish is not automatically the cheaper source of each gram of protein. In France the same math is approximately 12.2 versus 11.5 g per euro. Again, these figures follow from assumed prices and cooking yields; no store product was lab-tested.
Calculate the break-even price using your own bag
A useful shopping formula is cost of 150 g cooked = 150 ÷ cooking yield × raw usable price per kg ÷ 1,000. Write the yield as a decimal, such as 0.80, and make sure “raw usable” excludes discarded parts. Comparing package sticker prices without checking the actual net product quantity and edible yield can give a misleading answer.
Under the German assumptions (cod €12.00/kg, cod yield 80%, haddock yield 75%), haddock reaches the same per-portion cost when its raw usable price is €11.25/kg: 12.00 × 0.75 ÷ 0.80 = 11.25. Below that value haddock is cheaper per equal cooked 150 g; above it cod is cheaper in this simplified model. This threshold is for equal cooked weight, not equal grams of protein. For the latter you must divide each portion price by the 34.2 g or 30.0 g protein shown in the reference table.
If a frozen bag is offered for a specific total price, first divide by its declared usable net weight in kilograms to obtain €/kg. Then use your measured yield. Check whether two offers both name Atlantic cod or haddock, whether either has glaze, breading or sauce, and whether the price includes a large quantity you may not finish. If you buy an entire bag but cook only one fillet, keep “checkout expense” separate from “fish used tonight.”
What to look for on a frozen-fish label
In Germany, look for Kabeljau or Dorsch for cod and Schellfisch for haddock. In France, cod may appear as cabillaud (or sometimes morue, especially for salted or dried preparations), and haddock as églefin/aiglefin; smoked haddock is often a salted smoked product, not equivalent to plain frozen raw haddock. The scientific or commercial designation and ingredient list matter when retail naming is ambiguous. Never copy this plain-fillet USDA value onto a smoked or breaded product with a different label.
Check the net declared fish weight, added ingredients, water, protective ice glaze, whether the fillet is skinless and boneless, and the instructions for defrosting and cooking. A very large low €/kg bag might be poor value when freezer space is scarce. Conversely, portionable plain frozen fillets can make it easy to cook only what you need. Both products are naturally lean reference fish, but cooking oil and sauces can change a complete plate substantially.
Cook an equal and measurable portion
For a practical test, weigh about 187.5 g thawed usable cod, then weigh about 200.0 g thawed usable haddock. These starting weights follow only from the 80% and 75% trial assumptions. Pat dry, season each lightly with lemon, herbs and pepper, and cook each on a separate marked section of a tray until safely done. Do not presume that identical oven minutes give identical results: thickness and starting temperature vary. Weigh the drained edible cooked portions. If one is less than 150 g, it is not a 150 g serving just because the spreadsheet predicted that result.
A whole dinner can add 200 g cooked potatoes and 200 g vegetables to either fish. This makes the side dishes comparable, but the protein and cost tables in this article deliberately cover fish only. Oil, potato, vegetables and sauce must be added separately if you calculate meal calories or total spending. If making several portions, record actual weights once and use them instead of repeating the hypothetical yield indefinitely.
For safe handling, the FDA advises thawing frozen seafood in the refrigerator, not on the counter, or using cold-water methods when cooking promptly. It recommends cooking most seafood to 63 °C / 145 °F internally, with an opaque, easily flaking appearance as an additional visual sign. Follow the pack's instructions and avoid cross-contamination. If fish has an unpleasant sour, rancid or ammonia-like odour, do not taste it to check. These rules also apply to inexpensive frozen fish.
Nutrition context and a practical choice
Cod and haddock are both on the FDA/EPA “Best Choices” lower-mercury list, but that classification does not mean unlimited fish consumption or eliminate the need for dietary variety. Guidance for pregnant or breastfeeding people and children has age- and situation-specific portions. Our 150 g cooked test portion is a mathematical comparison and should not be mistaken for the *4 oz (about 113 g) uncooked*** adult serving used in FDA/EPA advice. The two weights refer to different contexts and preparation states.
Choose cod if you want the higher measured protein per 150 g cooked in the selected USDA records. Choose haddock if you prefer its flavour or can purchase it at a better usable-price/yield combination. The German and French figures are fully illustrative, so neither country has a guaranteed winner. A usable method is to identify the exact fish, weigh raw and cooked edible portions, compare protein on the correct cooked basis, and calculate costs from the price actually paid.
Sources
- USDA FoodData Central, Atlantic cod cooked by dry heat, SR Legacy FDC 171956 — 22.8 g protein, 0.86 g fat and 105 kcal per 100 g cooked.
- USDA FoodData Central, haddock cooked by dry heat, SR Legacy FDC 174198 — 20.0 g protein, 0.55 g fat and 90 kcal per 100 g cooked.
- USDA Agricultural Research Service food-yield tables — preparation yields vary; this article's 80% and 75% are hypothetical.
- FDA: selecting and serving fresh and frozen seafood safely — thawing and cooking recommendations.
- FDA/EPA: advice about eating fish — cod and haddock on the “Best Choices” list; 4 oz uncooked serving reference.
Scope: protein refers only to selected cooked-food records; all country prices and cooking yields are illustrative, not measured real-world prices, promotional offers or certified species averages.