
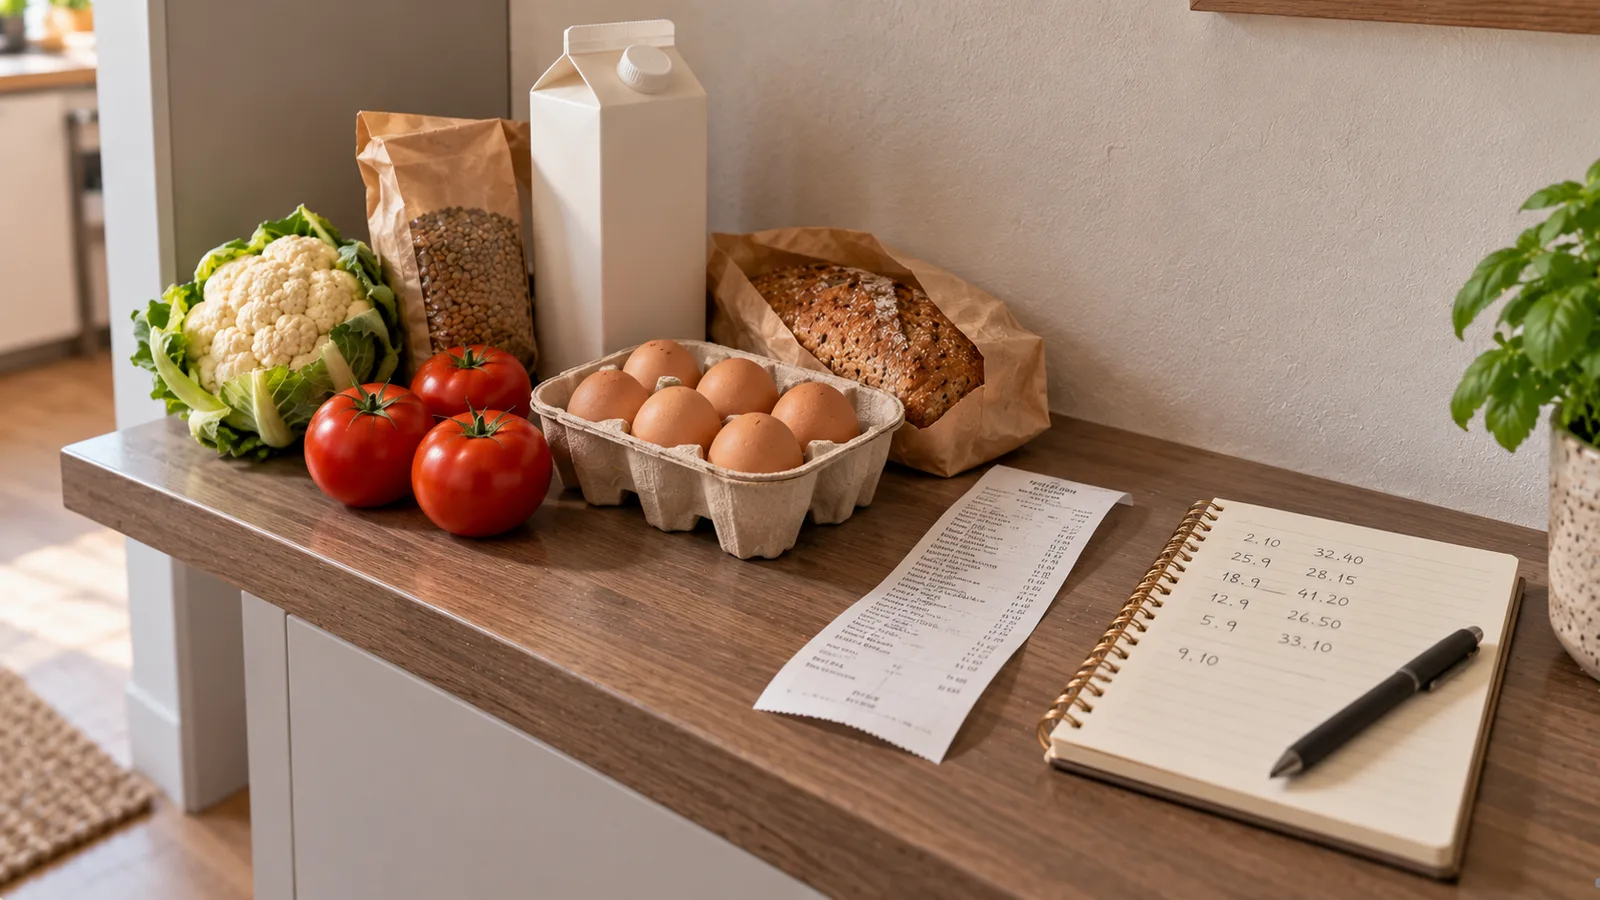
Tracking grocery spending is useful only if the numbers help you make better decisions.
You do not need to record every tomato in a complicated spreadsheet. A simple system can show:
- how much you actually spend on groceries;
- whether spending is rising or falling;
- which categories use the most money;
- how often unplanned purchases happen;
- whether food is being bought but not used;
- where small changes could have the biggest effect.
The key is to track consistently enough to see patterns without creating so much work that you stop doing it.
Decide what counts as grocery spending
Before tracking anything, define what belongs in your grocery budget.
A supermarket receipt may include:
- food;
- drinks;
- cleaning products;
- toiletries;
- pet food;
- household supplies.
If your goal is specifically to understand food spending, separate non-food items.
For example, a €72 supermarket receipt might contain:
| Category | Amount |
|---|---|
| Food | €54 |
| Household products | €11 |
| Toiletries | €7 |
| Total | €72 |
Your grocery-food spending for that trip is €54, not necessarily the full €72.
If you prefer simplicity, you can track the entire supermarket bill instead. The important part is to use the same definition consistently.
Choose a tracking period
Weekly and monthly views answer different questions.
Weekly tracking
Useful for:
- noticing unusually expensive shops quickly;
- controlling spending before the month is over;
- comparing planned and unplanned purchases.
Monthly tracking
Useful for:
- seeing the bigger pattern;
- comparing months;
- accounting for bulk purchases;
- understanding your average food budget.
For most households, using both is practical.
Record purchases as they happen, review them weekly, and calculate the monthly total at the end of the month.
Start with one simple number
If you have never tracked grocery spending before, begin with:
Total grocery spending per week
Example:
| Week | Grocery spending |
|---|---|
| Week 1 | €86 |
| Week 2 | €74 |
| Week 3 | €101 |
| Week 4 | €79 |
| Total | €340 |
Monthly total:
€86 + €74 + €101 + €79 = €340
Weekly average:
€340 ÷ 4 = €85
This immediately gives you a baseline.
Do not worry about detailed categories until the basic habit works.
Record purchases immediately
The easiest time to record a grocery purchase is shortly after making it.
You can use:
- a budgeting app;
- notes on your phone;
- a spreadsheet;
- bank transactions;
- saved receipts;
- a dedicated food-budget feature.
For each purchase, the minimum useful information is:
- date;
- store;
- total food amount.
Example:
| Date | Store | Food spending |
|---|---|---|
| 3 May | Supermarket | €46.20 |
| 6 May | Local shop | €12.80 |
| 8 May | Supermarket | €31.40 |
Weekly total:
€90.40
Separate grocery shopping from eating out
Restaurant meals, takeaway and delivery can make food spending look very different.
Decide whether you want to track:
- groceries only; or
- total food spending.
If you want the full picture, keep separate categories:
- groceries;
- restaurants;
- takeaway/delivery.
For example:
| Category | Monthly spending |
|---|---|
| Groceries | €360 |
| Restaurants | €125 |
| Delivery | €68 |
| Total food spending | €553 |
This prevents a reduction in grocery spending from looking like a saving when the difference was simply transferred to delivery.
Add categories only when they answer a question
Detailed categorization takes time.
Do not create 25 categories unless you will use them.
A practical system might use:
- protein foods;
- fruit and vegetables;
- grains and staples;
- dairy;
- snacks and sweets;
- drinks;
- convenience foods;
- other food.
You can also create categories based on the problem you want to investigate.
If you suspect snacks are increasing your bill, track snacks separately for a month.
If meat seems expensive, create a meat/fish category.
The categories should help answer a question.
Planned versus unplanned spending
One of the most useful distinctions is whether the purchase was planned.
Suppose a shopping trip costs €62.
Your list accounted for €49.
You also bought:
- dessert: €5;
- premium drink: €4;
- extra snack: €4.
Unplanned spending:
€5 + €4 + €4 = €13
That means about 21% of the trip was outside the original plan.
You do not need to eliminate every spontaneous purchase.
The value of tracking is seeing how frequently it happens and what it costs over time.
Track spending by shopping trip
Another useful metric is average cost per grocery trip.
Suppose you spent €380 during a month across eight grocery trips.
Average trip:
€380 ÷ 8 = €47.50
Next month you spend €390 across twelve trips.
Average trip falls to €32.50, but total spending rises.
This shows why average basket size alone does not tell the full story.
Shopping frequency matters too.
Calculate spending per person
For households with several people, total grocery spending is difficult to compare without context.
A simple calculation is:
Monthly grocery spending ÷ number of people
If a household of two spends €500:
€500 ÷ 2 = €250 per person per month
This is only a rough comparison.
Children, guests, different calorie needs, dietary restrictions and meals eaten outside the home can all change the result.
Still, it can be useful for tracking your own household over time.
Calculate a daily average
A daily average helps translate a monthly total into something easier to understand.
If you spend €450 during a 30-day month:
€450 ÷ 30 = €15 per day
For two people:
€15 ÷ 2 = €7.50 per person per day
Again, this is an average, not a daily spending target.
Bulk purchases can make individual days or weeks look very different.
Watch for bulk-buying distortion
Suppose you normally spend around €80 per week.
One week you spend €125 because you buy:
- a large bag of rice;
- several cans of beans;
- frozen fish;
- cooking oil.
The week looks expensive, but some of those foods will be used for several weeks.
This is why monthly trends are often more informative than judging a single shopping trip.
You can learn more in Buying in Bulk vs Smaller Packs: When Does It Actually Save Money?.
Track food waste when it matters
Spending data alone does not show whether purchased food was actually eaten.
If food waste is a recurring problem, add a simple waste log for one or two weeks.
Record:
- food discarded;
- approximate quantity;
- approximate cost;
- reason.
Example:
| Food | Approx. cost wasted | Reason |
|---|---|---|
| Salad | €2.00 | Spoiled |
| Yogurt | €1.20 | Expired |
| Bread | €1.50 | Too much purchased |
| Berries | €2.80 | Not eaten in time |
Total:
€7.50
The point is not to calculate waste perfectly.
It is to identify repeated causes.
Compare planned meals with actual purchases
Your grocery spending becomes more useful when connected to meal planning.
Suppose you planned five dinners but bought ingredients for eight different dinner ideas.
Some of those ingredients may remain unused.
Before shopping, compare:
- meals planned;
- ingredients already at home;
- quantities required;
- ingredients on the shopping list.
After shopping, compare the receipt with the list.
This creates a simple feedback loop:
plan → shop → eat → review
Use unit prices for real comparisons
Package price alone can be misleading.
For example:
- 500 g product for €2.40;
- 750 g product for €3.30.
Unit prices:
€2.40 ÷ 0.5 kg = €4.80/kg
€3.30 ÷ 0.75 kg = €4.40/kg
The larger package is cheaper per kilogram.
But it only saves money if you use it.
For direct comparisons, use the Unit Price Calculator.
Track price changes for foods you buy often
You do not need to record the price of every product forever.
Focus on foods you purchase frequently.
For example:
| Product | Previous price | Current price | Change |
|---|---|---|---|
| Oats, 1 kg | €1.79 | €1.99 | +€0.20 |
| Eggs | €2.99 | €3.19 | +€0.20 |
| Yogurt | €1.49 | €1.39 | -€0.10 |
This can help distinguish higher spending caused by buying more food from higher spending caused by price changes.
Review expensive categories
At the end of the month, identify the categories that account for the largest share of spending.
Do not automatically cut the largest category.
Ask why it is large.
For example, a protein category may be expensive because it contains fish, meat, dairy and other staple foods used throughout the month.
A smaller category of repeatedly unused convenience foods might offer a better opportunity to save.
Look for repeated small purchases
Large purchases attract attention, but repeated small purchases can add up.
Suppose you make three unplanned €6 purchases each week.
That is:
€18 per week
Over four weeks:
€72
Tracking helps make these patterns visible.
Compare your budget with actual spending
If your monthly grocery budget is €400 and you spend €460:
Difference = €460 - €400 = €60
Percentage above budget:
€60 ÷ €400 × 100 = 15%
The next question is not simply “How do I cut €60?”
First identify why the difference happened.
Possibilities include:
- food prices increased;
- more people ate at home;
- you bought pantry staples in bulk;
- unplanned purchases increased;
- food waste increased;
- the original budget was unrealistic.
A budget is useful when it reflects reality.
Use a rolling average
One month can be unusual.
A three-month average gives a more stable baseline.
Suppose spending is:
- January: €410;
- February: €455;
- March: €425.
Three-month average:
(€410 + €455 + €425) ÷ 3 = €430
You can then compare future months with €430 rather than reacting to one unusually high or low month.
A simple weekly review
Once a week, spend five minutes checking:
- How much did I spend?
- How many grocery trips did I make?
- Were there major unplanned purchases?
- Did I throw away food?
- Is there food at home that should be used soon?
Then decide whether anything needs changing next week.
You do not need a full financial analysis.
A useful monthly dashboard
At the end of each month, record:
| Metric | Example |
|---|---|
| Grocery spending | €420 |
| Budget | €400 |
| Difference | +€20 |
| Grocery trips | 9 |
| Average per trip | €46.67 |
| Estimated food waste | €14 |
| Restaurant spending | €95 |
| Delivery spending | €32 |
After several months, this becomes much more useful than isolated receipts.
What if you pay in cash?
Keep the receipt and record the purchase on the same day.
If you lose the receipt, record the best reasonable total rather than abandoning the entire month.
A slightly imperfect record is more useful than no record.
What if one receipt contains several categories?
You have two options.
Fast method
Record the whole supermarket receipt as grocery spending.
More precise method
Subtract non-food items.
For example:
Receipt total: €83
- toiletries: €9;
- cleaning products: €7.
Food spending:
€83 - €9 - €7 = €67
Choose the method you can maintain consistently.
Do not confuse tracking with cutting
Tracking grocery spending does not mean every number needs to decrease.
The first goal is visibility.
You may discover that:
- your grocery spending is already reasonable;
- buying more groceries reduces restaurant spending;
- higher-quality ingredients are worth the cost to you;
- bulk purchases create temporary spikes;
- the main problem is food waste rather than prices.
Use the data to make decisions instead of assuming that lower spending is always better.
A four-week starter system
Week 1: Track totals only
Record every grocery purchase.
Do not change your shopping behavior yet.
Week 2: Separate planned and unplanned purchases
Notice what gets added beyond the list.
Week 3: Identify one useful category
Track the area you most want to understand, such as snacks, drinks or protein foods.
Week 4: Review the month
Calculate:
- total spending;
- weekly average;
- number of trips;
- largest avoidable pattern;
- one change to test next month.
This keeps the system manageable.
Common tracking mistakes
Tracking too much from day one
An overly detailed system is easy to abandon.
Start with totals.
Forgetting small shops
A €4 or €8 purchase may seem insignificant, but repeated purchases affect the monthly total.
Mixing restaurants with groceries
Keep them separate if you want to understand grocery costs.
Judging one expensive week
Bulk purchases and irregular shopping can distort weekly totals.
Ignoring waste
Cheap food that gets thrown away is not actually economical.
Changing several things at once
If you change stores, products, meal plans and shopping frequency simultaneously, it becomes difficult to understand what affected spending.
How Mealisa can help
Mealisa can connect food planning with spending rather than treating them as separate tasks.
Products and prices can be associated with meals, while planned recipes and available ingredients can help estimate what needs to be purchased.
Over time, this can make it easier to see:
- how much planned meals cost;
- which products are purchased frequently;
- how food prices change;
- whether the weekly plan fits the intended budget;
- where unused food creates unnecessary spending.
The goal is not simply to record receipts.
It is to connect what you buy with what you actually plan to eat.
A simple template to start today
For each grocery trip, record:
| Field | Example |
|---|---|
| Date | 12 May |
| Store | Supermarket |
| Food total | €42.60 |
| Unplanned amount | €6.20 |
| Notes | Extra snacks |
At the end of the week add:
- total spending;
- number of trips;
- unplanned spending;
- food that was wasted.
At the end of the month, compare the result with your previous month or your planned budget.
That is enough to turn grocery spending from a vague impression into information you can actually use.