
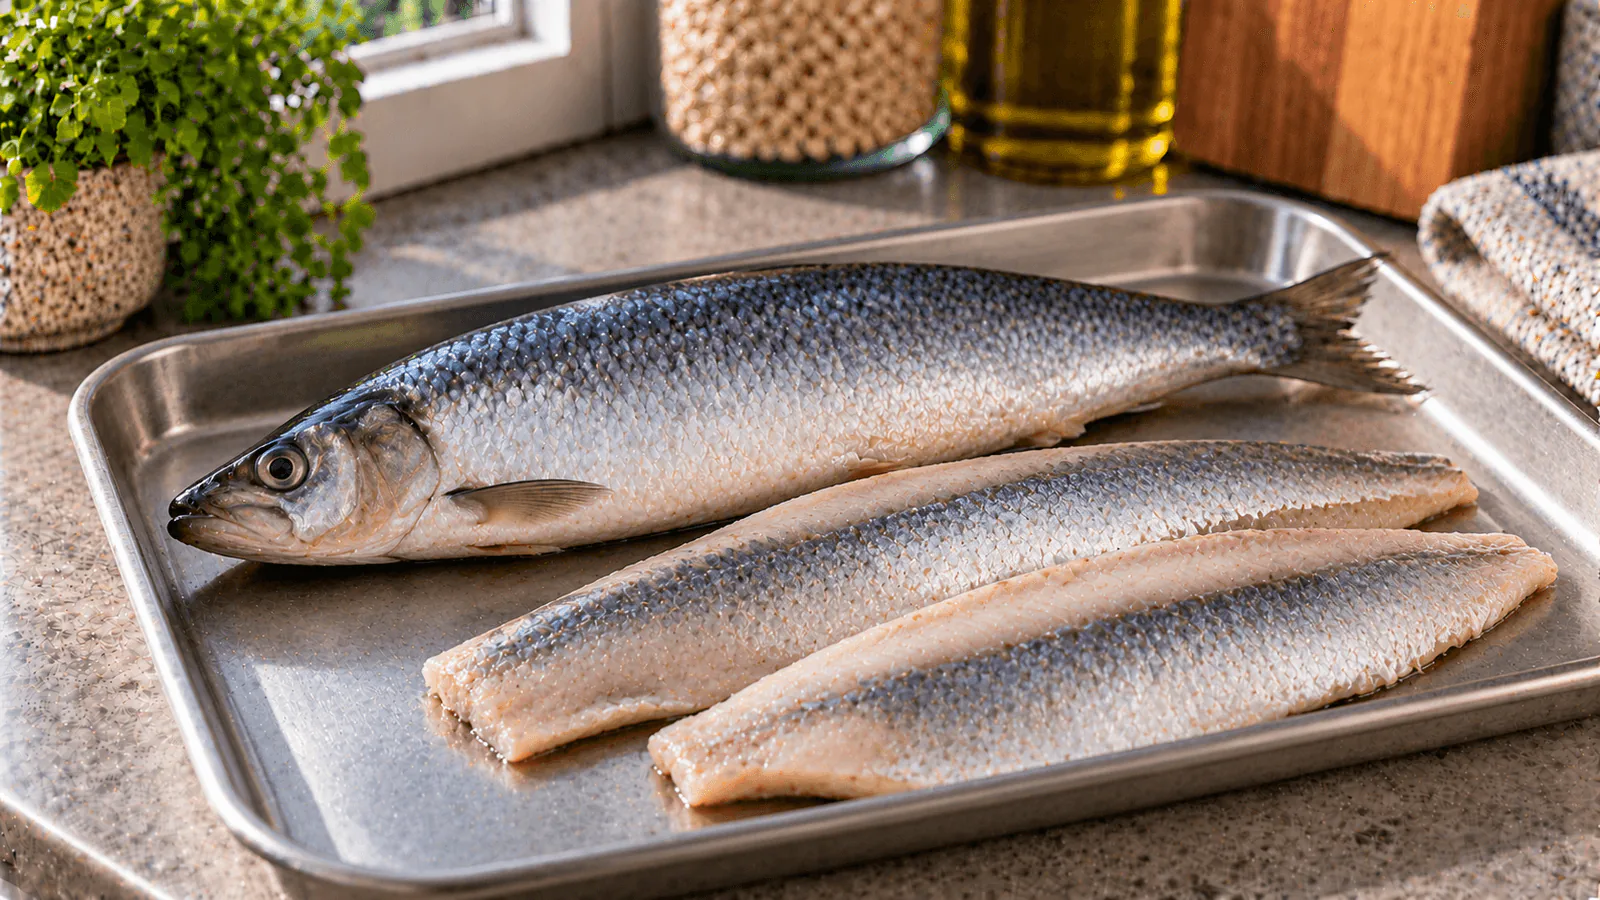
Herring is an oily fish, but there is no single calorie number for every serving sold as “herring.” A raw Atlantic herring fillet, an oven-cooked portion and herring preserved in a sweet-sour marinade are different foods. The packaging may also include oil, cream, onions or a sauce that changes the total. To estimate a meal accurately, identify the preparation first and weigh the edible fish or product you actually eat.
For a clear baseline, the USDA SR Legacy database lists 158 kcal per 100 g for raw Atlantic herring, 203 kcal per 100 g for Atlantic herring cooked with dry heat, and 262 kcal per 100 g for a specific pickled Atlantic herring reference. These values are not interchangeable. The purpose of comparing them is to pick the entry that matches the food, not to imply that cooking creates calories or that every jar of pickled herring has the same recipe.
Herring calories and nutrition per 100 g
| Atlantic herring reference food | Calories | Protein | Fat | Carbohydrate |
|---|---|---|---|---|
| Raw, edible fish | 158 kcal | 18.0 g | 9.0 g | 0.0 g |
| Cooked, dry heat | 203 kcal | 23.0 g | 11.6 g | 0.0 g |
| Pickled, USDA recipe reference | 262 kcal | 14.2 g | 18.0 g | 9.6 g |
Sources: USDA raw Atlantic herring, FDC 175116, USDA cooked Atlantic herring, FDC 175117 and USDA pickled Atlantic herring, FDC 175118. These are reference-food compositions for 100 g of edible product, not an average across all brands. Protein, fat and carbohydrate values are rounded; energy is taken directly from the listed record rather than recalculated from rounded macros.
The raw fish contains naturally occurring fat along with protein. Cooking generally drives off water, which increases nutrient concentration per 100 g of cooked weight. A dry-heat entry therefore has more calories and protein per 100 g than the raw entry. That does not demonstrate that a particular fillet gained energy in the oven. Compare equivalent starting and ending pieces rather than treating 100 g raw and 100 g cooked as the same individual serving.
Pickled herring is a separate food category. The USDA pickled reference reports carbohydrates because its preparation is not just plain fish. Some supermarket products use a sweet marinade; others use more salt, different amounts of oil or a cream sauce. Read the nutrition table on the actual container if you are logging a commercial product. A calorie value for plain cooked fish will not accurately describe a sweet pickled fillet.
Calories in 50 g, 85 g, 100 g and larger servings
The table scales each USDA reference by edible weight. An 85 g serving is approximately 3 oz, but it is not a promise that every fillet weighs that much. “Raw” means weighed before cooking, “cooked” means weighed after cooking and “pickled” means the reference edible product including the preparation represented by that entry.
| Edible portion | Raw Atlantic herring | Cooked, dry heat | Pickled reference |
|---|---|---|---|
| 50 g | 79 kcal | 102 kcal | 131 kcal |
| 75 g | 119 kcal | 152 kcal | 197 kcal |
| 85 g | 134 kcal | 173 kcal | 223 kcal |
| 100 g | 158 kcal | 203 kcal | 262 kcal |
| 120 g | 190 kcal | 244 kcal | 314 kcal |
| 150 g | 237 kcal | 305 kcal | 393 kcal |
| 200 g | 316 kcal | 406 kcal | 524 kcal |
Each number is calculated as the reference energy × portion weight ÷ 100, rounded to the nearest kcal. The three columns describe alternative preparations, not three ingredients to add together. The table helps with common portions but also works for any measured mass: if a drained packaged serving weighs 68 g, multiply the per-100-g value on its own label by 0.68.
Raw weight versus cooked weight: the common logging error
Suppose you start with 150 g of raw edible herring, which corresponds to approximately 237 kcal using the raw reference. After baking without added oil, the cooked fish may weigh less because water has been lost. Do not record the 150 g raw value and then add a second entry for the cooked fish: that counts the same portion twice. Equally, do not use the raw per-100-g figure on a weight obtained after cooking without checking your method.
If you have a weighed cooked portion but not its raw weight, the cooked entry is practical: 120 g cooked herring is approximately 244 kcal in the dry-heat reference. If you tracked its raw weight before cooking, stay with the raw entry and add actual cooking ingredients separately. Small differences between these two estimates are normal because the reference foods are compositional averages and cooking changes mass; they are not an exact before-and-after experiment on one fish.
For example, a pan meal made from 150 g raw herring plus 5 g of added olive oil yields a starting estimate of approximately 282 kcal for fish and oil combined: 237 kcal for the raw fish and roughly 45 kcal for the oil. This example excludes potatoes, bread, sauces and vegetables. If some oil remains in the pan, the amount eaten may be lower; estimating oil absorption precisely from appearance alone is unreliable. Record known quantities and state assumptions rather than inventing exact absorbed grams.
One more distinction matters with whole fish: head, spine, skin, bones and discarded parts should not be counted as eaten meat. A 250 g whole herring is not the same as 250 g edible flesh. Weigh fillets after cleaning if possible, or use a documented yield when you cannot. For bone-in dishes, the clearest routine is to record the edible fillet rather than the whole untrimmed fish.
Pickled, smoked, salted and oil-packed herring are not equivalent
Northern European shelves may offer Matjes-style herring, Bismarck herring, rollmops, smoked herring, oil-packed fillets and herring in cream. Those names describe different preservation methods or recipes, not one standard nutrition profile. The 262 kcal/100 g USDA value is specifically for its pickled Atlantic herring reference; it should not automatically be assigned to every Matjes, rollmop or herring salad.
Before choosing a database entry, inspect the ingredients and the nutrition panel. A jar with sugar and oil may be relatively energy-dense. A creamy sauce contributes energy that is not contained in plain fish numbers. Oil-packed fish can also differ depending on how much oil is eaten, drained or left behind. Similarly, the weight shown on a jar may include marinade, while the drained weight refers to the food remaining after liquid is removed. Match the number of grams to whichever product state the label describes; if the label covers the whole product including sauce, weigh that product consistently.
Smoked herring is not automatically the same as cooked dry-heat fish. Cold smoking, hot smoking and salting have different effects on water and salt content. When a named smoked product is available, its own label is preferable. This is the same practical distinction that applies to smoked salmon and other fish products: fish species and recipe both matter, even when the serving looks similar.
Salt and sodium in pickled herring
The USDA pickled reference contains approximately 870 mg sodium per 100 g, equivalent to about 2.18 g salt using the common sodium-to-salt factor of 2.5. A 50 g portion contributes roughly 435 mg sodium, or about 1.09 g salt equivalent. A larger 85 g portion provides around 740 mg sodium, corresponding to approximately 1.85 g salt. These are reference calculations and should not replace a retailer's declared values.
For labels in Germany, France and elsewhere in the EU, “salt” is normally declared directly in grams per 100 g, while US-style panels frequently show sodium in milligrams. Do not add the sodium number and the salt number as though they were two separate nutrients. Our sodium-to-salt conversion guide explains the units and makes comparing preserved foods easier. If monitoring sodium for a medical reason, base decisions on your own product label and the advice of your clinician rather than treating one generic herring value as a limit.
The marinade deserves attention beyond calories. Some products contain considerable added sugar; others rely on vinegar and salt. Sweetness in a recipe is not enough to calculate sugar grams reliably. Check the “of which sugars” or “total sugars” row and compare similar packages per 100 g. Rinsing or draining a fillet may change the amount of sauce consumed, but cannot justify an exact calorie reduction without a measurement or a product-specific reference.
Protein, omega-3 fats and the bigger nutrition picture
Plain Atlantic herring supplies protein and fat, including long-chain omega-3 fatty acids. The raw USDA reference provides about 18 g protein per 100 g, while its dry-heat cooked entry provides 23 g per 100 g cooked weight. The difference is mainly concentration after water loss, not protein appearing during cooking. Herring also supplies nutrients such as vitamin B12 and vitamin D, though amounts depend on species, season, product and preparation.
The presence of omega-3 fats does not make every serving nutritionally identical or cancel out the added salt and sauces in preserved products. Fish can be a useful part of a varied pattern; portion sizes and the rest of the meal still count. If you are comparing oily fish choices, the mackerel nutrition guide offers another species-specific baseline, while the sardines calorie guide shows why canned fish needs its own product state. These comparisons are more informative than assigning every oily fish the same calories.
For mercury, the FDA/EPA Advice about Eating Fish places herring in its “Best Choices” group. That list helps people who are pregnant, breastfeeding, might become pregnant and caregivers choose among fish species; it does not mean unlimited consumption of any preserved product, nor does it replace specific clinical dietary guidance. Fish allergy is a separate issue: herring is fish and is not suitable for someone allergic to fish.
Practical ways to track a herring meal
A reliable record begins with the food as eaten. For fresh fillets, write down raw edible grams before cooking or cooked edible grams afterward; do not mix those states. For ready-to-eat herring, look up the exact brand, preparation and amount, especially where oil, sauce or marinade is involved. If you only have a generic entry, choose the closest form and keep the uncertainty visible rather than reporting false precision.
For a sandwich, count the herring and bread separately, plus butter, mayonnaise or dressing. For a potato salad with herring, weigh the potatoes, fish and creamy dressing as separate components when possible. Restaurant servings are estimates unless ingredient weights are supplied. A photo can help recognize the dish, but it cannot reveal hidden oil or the net weight of fish beneath a sauce. Repeating a consistent estimate is often better than switching between raw, cooked and pickled entries for the same purchased product.
In short, raw Atlantic herring has 158 kcal/100 g, the dry-heat cooked reference 203 kcal/100 g, and the USDA pickled reference 262 kcal/100 g. The correct number depends on preparation, edible weight and the actual label. Sources for the three comparison states are USDA raw herring, USDA cooked herring and USDA pickled herring.