
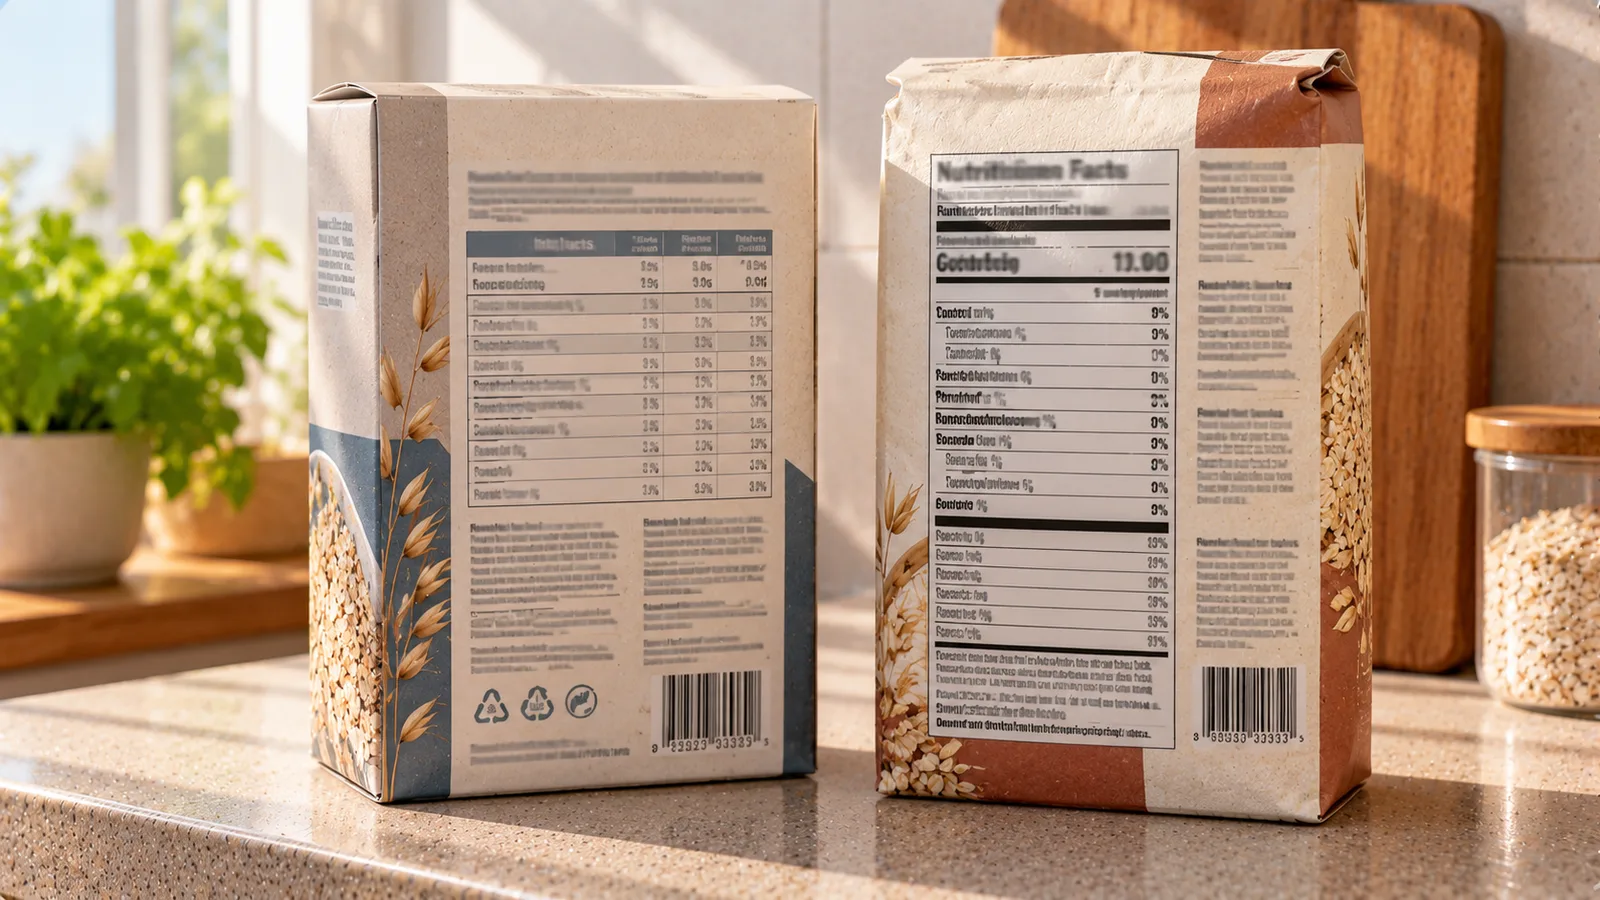
Nutrition labels in the European Union and the United States often contain similar information, but they are not formatted or calculated in exactly the same way.
This matters when you track food from different countries, copy nutrition data into an app or compare an imported US product with a European product.
The biggest practical differences involve the reference quantity, carbohydrate and fiber presentation, salt versus sodium, and the way serving information is emphasized.
EU and US labels at a glance
| Feature | EU | US |
|---|---|---|
| Main standardized comparison | Usually per 100 g or 100 ml | Usually per serving |
| Energy | kJ and kcal | Calories |
| Serving information | May also be provided | Central part of Nutrition Facts |
| Carbohydrate | Generally excludes fiber | Total Carbohydrate includes dietary fiber |
| Fiber | Separate optional/declared nutrient depending on context | Included under Total Carbohydrate |
| Salt / sodium | Salt is declared | Sodium is declared |
| Daily reference | Reference Intakes may be shown | % Daily Value is prominent |
The practical lesson is simple: do not copy a number from one system into another without checking what that number represents. (European Union — Regulation (EU) No 1169/2011)
1. EU labels usually make 100 g or 100 ml the common reference
Under EU nutrition-labeling rules, mandatory nutrition information is generally expressed per 100 g for foods or per 100 ml for liquids.
A product might show:
- 250 kcal per 100 g;
- 12 g fat per 100 g;
- 30 g carbohydrate per 100 g;
- 8 g protein per 100 g.
This makes direct comparison between similarly packaged products relatively straightforward.
If you eat 60 g:
250 × 60 ÷ 100 = 150 kcal
Manufacturers can also provide information per portion, but the per-100-g or per-100-ml reference remains particularly important.
2. US labels emphasize the serving
The US Nutrition Facts label prominently presents values for a defined serving size.
For example:
Serving size: 2/3 cup (55 g)
The nutrition numbers underneath generally correspond to that serving.
If the label says:
Calories: 230
that means approximately 230 Calories for the stated 55 g serving, not for 100 g.
This distinction is critical when copying information into a database that expects values per 100 g.
Converting a US serving to 100 g
Suppose a US label says:
- serving size: 55 g;
- calories: 230.
To calculate calories per 100 g:
230 ÷ 55 × 100 ≈ 418 kcal per 100 g
If you accidentally enter 230 kcal as the per-100-g value, the food will be substantially undercounted.
Converting an EU value to your portion
Suppose an EU package says:
418 kcal per 100 g
and you eat 55 g.
Calculate:
418 × 55 ÷ 100 ≈ 230 kcal
The two labels can therefore describe essentially the same product while displaying very different headline numbers.
3. “Carbohydrate” does not mean exactly the same thing
This is one of the most important differences when transferring macros between EU and US labels.
On an EU label, the declared carbohydrate value generally represents available carbohydrate and does not include fiber.
Fiber may be listed separately.
A simplified EU example might show:
- carbohydrate: 20 g;
- fiber: 5 g.
You should not normally add the 5 g of fiber to the 20 g carbohydrate when copying the European carbohydrate value into a field designed for EU-style available carbohydrate.
US Total Carbohydrate includes dietary fiber
On a US Nutrition Facts label, Total Carbohydrate includes dietary fiber.
A simplified US label might show:
- Total Carbohydrate: 25 g;
- Dietary Fiber: 5 g.
The 5 g fiber is part of the 25 g Total Carbohydrate figure.
This means an EU label showing 20 g carbohydrate plus 5 g fiber and a US label showing 25 g Total Carbohydrate including 5 g fiber can describe broadly similar carbohydrate composition.
The numbers should not be compared as though both systems define the top-line carbohydrate field identically.
Why this causes tracking errors
Imagine a user sees this US label:
- Total Carbohydrate: 25 g;
- Dietary Fiber: 5 g.
They manually enter:
- carbs: 25 g;
- fiber: 5 g.
That may be appropriate in a database designed around US label conventions.
But if another system expects available carbohydrate excluding fiber and the user copies 25 g into that field, the resulting macro data may not match the intended convention.
The first question should therefore be:
What does this app mean by “carbohydrate”?
4. Fiber needs to be interpreted with the carbohydrate convention
Fiber should not automatically be subtracted from every carbohydrate number you see.
A common internet rule says:
net carbs = total carbs − fiber
That can be misleading when applied across countries.
If a European label already reports carbohydrate excluding fiber, subtracting fiber again would incorrectly reduce the value.
Before doing any calculation, identify the labeling system.
Example: the same conceptual composition
Consider a simplified food with:
- 20 g available carbohydrate;
- 5 g fiber.
A European-style presentation could show:
- carbohydrate: 20 g;
- fiber: 5 g.
A US-style presentation could show:
- Total Carbohydrate: 25 g;
- Dietary Fiber: 5 g.
Seeing 20 g on one package and 25 g on another does not necessarily mean the second food contains 5 g more digestible carbohydrate.
The definitions differ.
5. EU labels show salt; US labels show sodium
This is another major source of confusion.
European nutrition declarations generally list salt.
US Nutrition Facts labels list sodium.
Salt and sodium are related, but the numbers are not interchangeable.
A useful approximate relationship is:
salt ≈ sodium × 2.5
when both are expressed in the same mass units.
For example:
800 mg sodium = 0.8 g sodium
Approximate salt equivalent:
0.8 × 2.5 = 2.0 g salt
Do not enter 800 mg sodium as 800 mg salt.
Converting salt to sodium
The reverse approximation is:
sodium ≈ salt ÷ 2.5
If a European product contains 1.5 g salt:
1.5 ÷ 2.5 = 0.6 g sodium
That is approximately:
600 mg sodium
These conversions are useful when comparing products across the two systems.
6. Energy may be displayed differently
EU labels generally display energy in both:
- kilojoules (kJ);
- kilocalories (kcal).
For example:
840 kJ / 200 kcal
US labels normally emphasize:
Calories 200
On US food labels, the word “Calories” with a capital C refers to kilocalories in nutritional usage.
So:
200 Calories = 200 kcal
You do not need to multiply the US number by 1,000.
Kilojoules and kilocalories
If only kilojoules are available, the approximate relationship is:
1 kcal ≈ 4.184 kJ
Therefore:
840 kJ ÷ 4.184 ≈ 201 kcal
Small differences can occur because of rounding.
When kcal is already printed on the European label, use that value rather than recalculating it from kJ.
7. Serving size plays a different practical role
European packages may provide serving information, but standardized per-100-g or per-100-ml values make cross-product comparison easy.
US labels place much more visual emphasis on the serving.
This means you should always inspect:
- serving weight;
- number of servings per container;
- whether the displayed nutrients are per serving;
- whether the package may reasonably be consumed in more than one serving.
Example: two servings in one package
A US package contains:
- 2 servings;
- 300 kcal per serving.
Eating the entire package means:
2 × 300 = 600 kcal
If you log only the displayed 300 kcal, you have recorded half the actual amount consumed.
The same principle applies to macros.
8. Dual-column labels can change the comparison
Some US packages may display nutrition information in two columns, for example:
- per serving;
- per package.
When both are shown, use the column that corresponds to what you actually ate.
Do not automatically assume the largest calorie number is per 100 g. US labels are not structured around the European per-100-g convention.
9. Portion sizes are not universal recommendations
A serving size printed on a package is useful for interpreting the nutrition information, but it does not necessarily mean that every person should eat exactly that amount.
For food tracking, the correct approach is:
- identify the label's reference serving;
- identify the amount you actually ate;
- scale the values accordingly.
If a label uses a 40 g serving and you eat 65 g:
65 ÷ 40 = 1.625 servings
Multiply the nutrition values by 1.625.
10. Comparing calories correctly
Suppose you have:
European cereal
- 390 kcal per 100 g.
American cereal
- 210 Calories per 55 g serving.
Convert the US cereal:
210 ÷ 55 × 100 ≈ 382 kcal per 100 g
Now the comparison is meaningful:
- EU cereal: 390 kcal/100 g;
- US cereal: ~382 kcal/100 g.
Comparing 390 directly with 210 would have been misleading.
11. Comparing protein correctly
Suppose the US cereal provides:
6 g protein per 55 g
Per 100 g:
6 ÷ 55 × 100 ≈ 10.9 g
If the European cereal contains 9 g protein per 100 g, you can now compare the products on the same basis.
12. Comparing fat correctly
The same conversion applies to fat.
US product:
- 8 g fat per 55 g.
Per 100 g:
8 ÷ 55 × 100 ≈ 14.5 g
European product:
- 13 g fat per 100 g.
Once both values use the same reference weight, the comparison becomes straightforward.
13. Liquids: 100 ml versus serving volume
European beverage labels normally provide mandatory nutrition information per 100 ml.
A US beverage may use a serving such as:
- 8 fl oz;
- 12 fl oz;
- one bottle.
Do not treat milliliters and grams as automatically identical for every liquid.
For direct beverage comparison, converting both labels to the same volume—such as 100 ml—is usually the clearest approach.
Example: US beverage to 100 ml
Suppose a drink contains:
- 150 Calories per 355 ml.
Per 100 ml:
150 ÷ 355 × 100 ≈ 42 kcal per 100 ml
A European drink labeled at 40 kcal per 100 ml can then be compared directly.
14. Added sugars are especially important to interpret by region
US Nutrition Facts labels include a line for Added Sugars within the carbohydrate section.
European mandatory nutrition declarations generally show sugars, but do not use the same mandatory “Added Sugars” line as the US Nutrition Facts format.
Therefore, a European “of which sugars” value should not automatically be interpreted as added sugar.
It can include sugars naturally present in ingredients as well as added sugars.
The ingredient list can provide additional context.
Example: plain dairy product
A plain dairy product may contain naturally occurring lactose.
Its European label can show sugars even if no sugar was added during manufacturing.
Treating the entire “of which sugars” number as added sugar would therefore be incorrect.
15. Daily percentages use different frameworks
US labels prominently show % Daily Value (%DV).
EU packages may show percentages based on Reference Intakes (RI) for an average adult.
These systems have different regulatory frameworks and presentation rules.
Do not assume that an EU percentage and a US %DV are directly interchangeable.
For tracking your own intake, the absolute quantity—grams, milligrams or calories—is often the safer value to transfer.
16. Why per-100-g comparison is useful
When comparing products from different countries, converting both to 100 g can remove much of the serving-size noise.
The general formula is:
value per serving ÷ serving weight × 100
For liquids:
value per serving ÷ serving volume × 100
This works well for:
- calories;
- protein;
- fat;
- many carbohydrate comparisons, once definitions are understood;
- fiber;
- sodium or salt after appropriate conversion.
17. Why per-100-g comparison is not enough for every question
A product comparison and a meal comparison are different tasks.
Two foods may have similar calories per 100 g but usually be eaten in very different quantities.
For actual food tracking, calculate the amount you consumed after normalizing the label.
For product comparison, per 100 g or per 100 ml is often useful.
A practical cross-border label workflow
When logging an imported food:
Step 1: identify the country or label system
Is it an EU-style label or a US Nutrition Facts label?
Step 2: identify the reference quantity
Is the nutrition information:
- per 100 g;
- per 100 ml;
- per serving;
- per container?
Step 3: record the serving weight
If the label is US-style, find the serving weight in grams or volume in milliliters where available.
Step 4: convert only if your app requires it
If your database expects per-100-g values:
per-serving value ÷ serving grams × 100
Step 5: interpret carbohydrate correctly
Check whether fiber is included in the carbohydrate figure.
Step 6: distinguish salt from sodium
Convert only when necessary.
Step 7: log your actual portion
Once the food entry is correct, scale it to the amount actually eaten.
Worked example: US label entered into a European-style database
A US product shows:
- serving: 40 g;
- Calories: 180;
- Total Fat: 7 g;
- Total Carbohydrate: 24 g;
- Dietary Fiber: 4 g;
- Protein: 5 g;
- Sodium: 240 mg.
Per 100 g:
Calories:
180 ÷ 40 × 100 = 450 kcal
Fat:
7 ÷ 40 × 100 = 17.5 g
US Total Carbohydrate:
24 ÷ 40 × 100 = 60 g
Fiber:
4 ÷ 40 × 100 = 10 g
Protein:
5 ÷ 40 × 100 = 12.5 g
Sodium:
240 ÷ 40 × 100 = 600 mg per 100 g
Approximate salt equivalent:
0.6 g × 2.5 = 1.5 g salt per 100 g
But there is an important carbohydrate warning.
If the European-style database expects available carbohydrate excluding fiber, you should not blindly copy the US Total Carbohydrate value into that field. The database's nutrient definition must be checked first.
Worked example: European label compared with a US label
European product:
- 420 kcal/100 g;
- 18 g fat/100 g;
- 52 g carbohydrate/100 g;
- 7 g fiber/100 g;
- 10 g protein/100 g;
- 1.2 g salt/100 g.
US product, per 50 g serving:
- 205 Calories;
- 8 g fat;
- 29 g Total Carbohydrate;
- 3 g fiber;
- 5 g protein;
- 220 mg sodium.
Convert the US values to 100 g:
- calories: 410 kcal;
- fat: 16 g;
- Total Carbohydrate: 58 g;
- fiber: 6 g;
- protein: 10 g;
- sodium: 440 mg.
Approximate salt equivalent:
0.44 × 2.5 = 1.1 g salt
Calories, fat, protein and salt can now be compared more directly.
The carbohydrate values still require awareness that the EU and US headline carbohydrate fields use different conventions.
Common mistakes when moving between EU and US labels
Avoid these errors:
- treating a US per-serving calorie value as kcal per 100 g;
- comparing serving values with per-100-g values;
- subtracting fiber from an EU carbohydrate value that already excludes fiber;
- assuming US Total Carbohydrate and EU carbohydrate have identical definitions;
- treating sodium and salt as the same number;
- reading European “sugars” as though it means US “Added Sugars”;
- assuming one serving equals the amount you personally ate;
- copying %DV or RI percentages as though they were nutrient quantities;
- converting values that are already provided in the unit your tracker needs.
Quick comparison checklist
Before copying nutrition data from an unfamiliar label, check:
- EU or US label?
- Per 100 g, per 100 ml or per serving?
- What is the serving weight?
- Does carbohydrate include fiber?
- Is the label showing salt or sodium?
- Are sugars total sugars or specifically added sugars?
- Are you logging the label's serving or your actual portion?
Those seven checks prevent many cross-border food-tracking errors.
The key principle
EU and US nutrition labels are not contradictory systems. They simply use different conventions.
The safest approach is not to memorize isolated numbers but to identify:
reference amount → nutrient definition → unit → actual portion
Once those four elements are clear, calories and macros can usually be transferred or compared accurately without mixing incompatible label conventions.
Sources
- Regulation (EU) No 1169/2011 on the provision of food information to consumers.
- European Commission, food information and nutrition labeling guidance.
- U.S. Food and Drug Administration, Nutrition Facts Label guidance.
- U.S. Food and Drug Administration, serving-size and Daily Value guidance.