
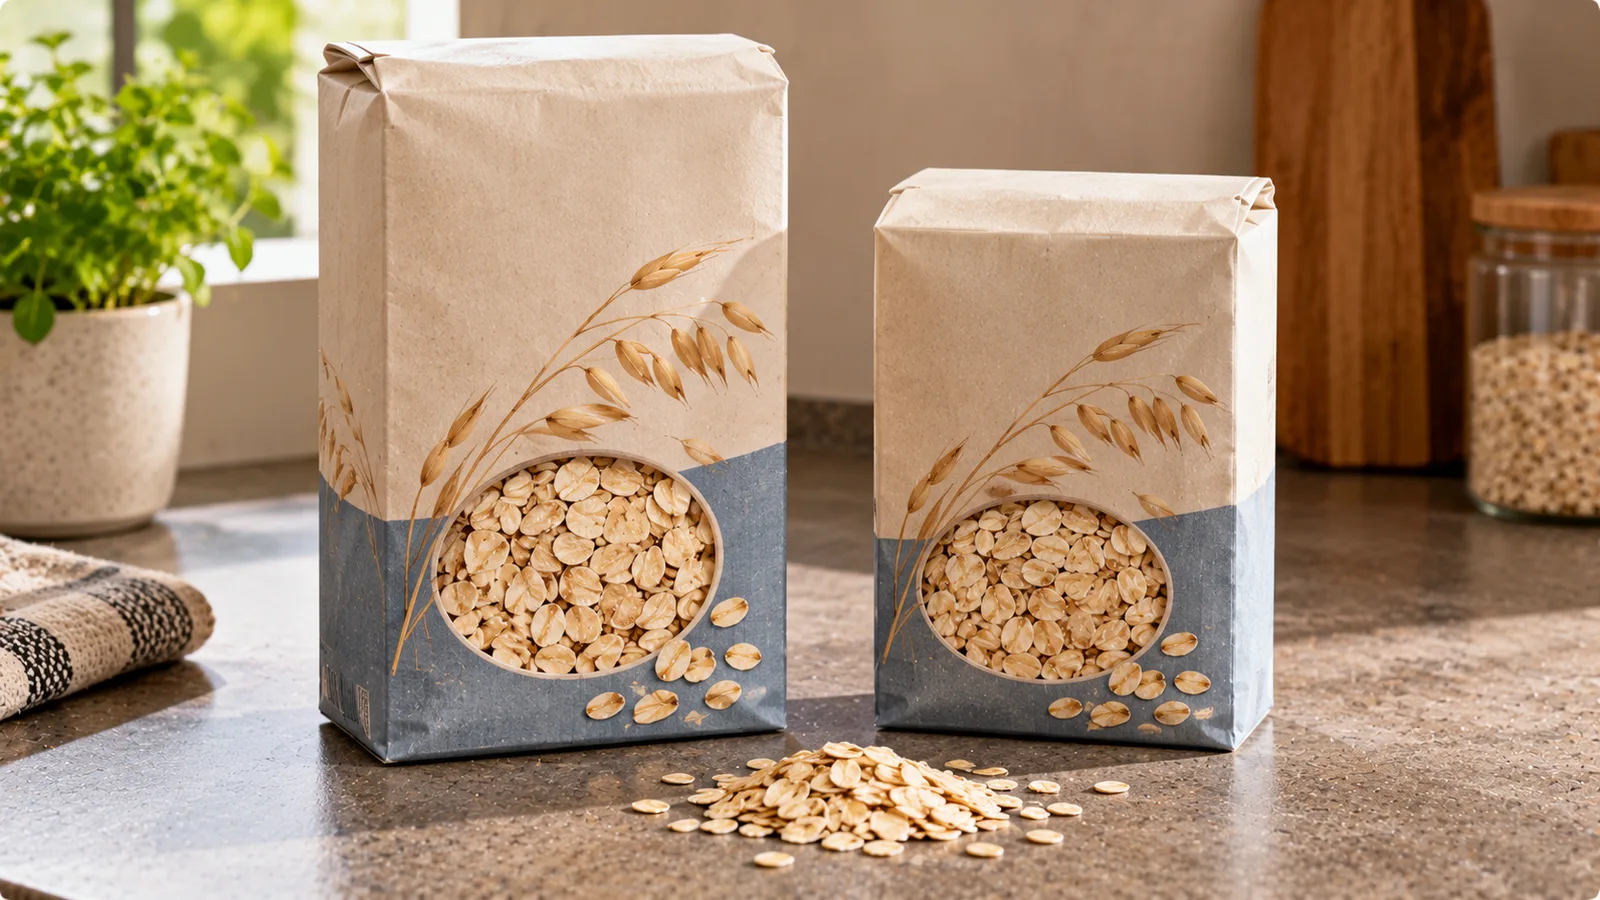
A grocery product can become more expensive even when the price printed on the shelf stays exactly the same.
The reason is simple: the package may contain less food.
A bag of rice that previously contained 1 kg might now contain 900 g. A yogurt container may shrink from 500 g to 450 g. A packet of biscuits may contain fewer biscuits while retaining a similar appearance.
This practice is commonly called shrinkflation.
To understand whether your groceries are becoming more expensive, you need to compare both the price and the quantity of food you receive.
The most useful starting point is the price per standard unit, such as one kilogram or one liter.
Why comparing shelf prices is not enough
Imagine that a package of pasta cost €2.00 last month.
This month, the same product still costs €2.00.
At first glance, there has been no price increase.
But suppose the old package contained 500 g and the new package contains 450 g.
The shelf price is unchanged, yet the amount of pasta has fallen by 10%.
You now pay more for every gram.
| Measurement | Old package | New package |
|---|---|---|
| Shelf price | €2.00 | €2.00 |
| Net weight | 500 g | 450 g |
| Price per kg | €4.00 | €4.44 |
| Change in unit price | — | +11.1% |
The effective price increase is approximately 11.1%, not 0%.
That distinction matters when tracking household food spending.
All prices and product examples in this article are hypothetical calculations, not observations about specific retailers.
The formula for comparing grocery prices
For products sold by weight:
Price per kg = package price ÷ package weight in kg
For products sold by volume:
Price per liter = package price ÷ package volume in liters
To calculate the percentage change:
Unit price change (%) = ((new unit price ÷ old unit price) − 1) × 100
Example:
Old product: €2.00 for 500 g.
2.00 ÷ 0.5 = €4.00/kg
New product: €2.00 for 450 g.
2.00 ÷ 0.45 = €4.44/kg
Percentage change:
((4.444... ÷ 4.00) − 1) × 100 = 11.1%
The calculation compares the cost of the same amount of product, rather than simply the amount paid at checkout.
Why a 10% smaller package means an 11.1% higher unit price
Percentage changes are not always symmetrical.
If a package becomes 10% smaller while the price stays constant, the unit price rises by more than 10%.
The relationship is:
Unit price multiplier = 1 ÷ (1 − size reduction fraction)
For a 10% reduction:
1 ÷ 0.90 = 1.111...
That means the unit price rises by approximately 11.1%.
Here are several examples where the shelf price remains unchanged:
| Package size reduction | Increase in unit price |
|---|---|
| 5% | 5.3% |
| 10% | 11.1% |
| 15% | 17.6% |
| 20% | 25.0% |
| 25% | 33.3% |
A 20% reduction in quantity does not produce a 20% increase in unit price.
It produces a 25% increase.
This is why calculating the new price per kilogram or liter is more reliable than estimating from package size alone.
When both the price and package size change
Sometimes manufacturers change the quantity and retailers change the shelf price at the same time.
Suppose a cereal package changes as follows:
| Measurement | Before | After |
|---|---|---|
| Price | €3.20 | €3.50 |
| Weight | 800 g | 700 g |
| Price per kg | €4.00 | €5.00 |
The shelf price increased by:
((3.50 ÷ 3.20) − 1) × 100 = 9.4%
But the price per kilogram increased by:
((5.00 ÷ 4.00) − 1) × 100 = 25%
The effective increase is much larger than the shelf-price increase.
This calculation captures both changes together.
Do not add the shelf-price percentage and package-size percentage as if they were independent price increases. Use the unit-price formula instead.
A shortcut when you know both percentage changes
If the shelf price rises by 8% and the package becomes 10% smaller, the unit-price multiplier is:
1.08 ÷ 0.90 = 1.20
The effective unit-price increase is therefore 20%.
The general formula is:
New unit price ÷ old unit price = price multiplier ÷ quantity multiplier
For example:
- A 5% price increase gives a price multiplier of 1.05.
- A 10% quantity reduction gives a quantity multiplier of 0.90.
- The combined multiplier is 1.05 ÷ 0.90 = 1.1667.
The effective unit-price increase is approximately 16.7%.
This shortcut is useful when comparing many products and the percentage changes are already known.
Compare the same product specification
A lower or higher unit price does not always mean that two packages contain equivalent products.
Before comparing, check:
- Product type and variety.
- Brand and formulation.
- Fat or protein content where relevant.
- Organic or conventional designation.
- Fresh, frozen, dried or canned form.
- Net weight versus drained weight.
- Number of servings if the product is sold by count.
For example, 400 g of canned beans including liquid is not necessarily equivalent to 400 g of drained beans.
Similarly, concentrated tomato paste should not be compared directly with ready-to-use tomato sauce as though they were identical.
A valid price comparison requires a meaningful common basis.
Net weight versus drained weight
Canned foods can be particularly confusing.
A can may display a total net weight of 400 g but contain only 240 g of drained beans.
If the beans are the part you intend to eat, the drained weight may be the more useful denominator.
Consider two hypothetical products:
| Product | Shelf price | Drained weight | Price per kg drained |
|---|---|---|---|
| Beans A | €0.99 | 240 g | €4.13 |
| Beans B | €1.19 | 300 g | €3.97 |
Beans B cost more per can but less per kilogram of drained beans.
The calculation assumes the drained beans are the comparable edible component.
For foods where the liquid is also used, the most appropriate comparison may differ.
Comparing products sold by count
Not every grocery product is best compared by kilograms.
Eggs, tortillas, tea bags and some snack products are often purchased by count.
For comparable items:
Price per item = package price ÷ number of items
Example:
| Package | Price | Count | Price per item |
|---|---|---|---|
| A | €2.40 | 8 | €0.30 |
| B | €2.70 | 9 | €0.30 |
The price per item is identical.
However, counting alone can be misleading when individual pieces change size.
If a biscuit package contains fewer biscuits and each biscuit is also smaller, weight-based comparison is more informative.
For eggs, differences in size category and production method can also matter.
Choose the unit that best reflects what you are actually buying.
Promotions can hide the underlying trend
A temporary discount can make a product appear cheaper even after its regular unit price has increased.
Suppose a 500 g product originally cost €2.50.
Its regular price later rises to €2.90, but a promotion temporarily reduces it to €2.30.
If you compare only the original regular price with the promotional price, you might conclude that the product has become cheaper.
In reality, its regular price per kilogram has increased from €5.00 to €5.80.
For useful tracking, record both:
- Regular shelf price.
- Actual promotional price paid.
These answer different questions.
The regular price helps identify changes in the product's normal pricing.
The actual price paid helps explain your household's real spending.
How to build a simple grocery price tracker
You do not need a complicated system.
A spreadsheet or basic note can be enough.
Use these fields:
| Field | Example |
|---|---|
| Date | 10 October 2026 |
| Store | Store A |
| Product | Plain yogurt |
| Brand or variant | Product X |
| Package size | 450 g |
| Shelf price | €1.49 |
| Price per kg | €3.31 |
| Promotion | No |
| Notes | Previously sold in 500 g package |
The example is illustrative.
The most important fields are the date, comparable product specification, quantity and price.
Without a date, it becomes difficult to distinguish current prices from older observations.
Without the package size, it is impossible to identify shrinkflation reliably.
Track changes over time
Suppose you record the same hypothetical yogurt product at three dates.
| Date | Package | Price | Price per kg |
|---|---|---|---|
| January | 500 g | €1.39 | €2.78 |
| April | 500 g | €1.49 | €2.98 |
| October | 450 g | €1.49 | €3.31 |
Between January and October, the shelf price increased by approximately 7.2%.
But the unit price increased by approximately 19.1%.
The second figure better reflects the price change for a fixed amount of yogurt.
If the product formulation or quality changed materially, note that as well.
The calculation identifies a change in the price per kilogram, not the cause of the change.
Compare the cost of a fixed grocery basket
Individual products are useful, but a household budget depends on the combined cost of many purchases.
A fixed basket lets you compare the cost of buying the same quantities at different times.
Imagine a weekly basket containing:
| Product | Fixed quantity |
|---|---|
| Rice | 1 kg |
| Pasta | 1 kg |
| Yogurt | 1 kg |
| Apples | 2 kg |
| Eggs | 10 comparable eggs |
For each date, calculate the cost of those fixed quantities using the observed unit prices.
Then add the amounts.
Suppose the basket costs €15.00 at the beginning of the period and €17.40 later.
The increase is:
((17.40 ÷ 15.00) − 1) × 100 = 16%
This is a price change for that particular basket.
It is not an official inflation rate and should not be presented as representative of all households.
A basket becomes less comparable if its contents, quality or quantities change.
Fixed basket versus actual spending
Two different measures can both be useful.
Fixed-basket cost asks:
How much would the same collection of products and quantities cost now compared with before?
Actual spending asks:
How much money did the household really spend?
These figures can move differently.
For example, grocery prices may rise while a household reduces spending by purchasing fewer snacks, switching brands or wasting less food.
Alternatively, actual spending may rise because the household has more people to feed, even if unit prices are unchanged.
To understand grocery inflation in your own records, separate price changes from changes in quantities and purchasing choices.
What if you switch brands?
Switching brands can reduce your grocery bill, but it complicates tracking the price of a particular product.
Suppose your usual rice rises from €2.00/kg to €2.50/kg.
You switch to a comparable alternative costing €2.20/kg.
Two things have happened:
- Your original product became 25% more expensive.
- Your new purchase costs €2.20/kg instead of €2.50/kg.
Both facts matter.
For price monitoring, keep the original product's historical series separate.
For household budgeting, record the product actually purchased.
This prevents brand switching from hiding genuine price changes.
How to compare multipacks
Multipacks can make unit prices less obvious.
Suppose one offer contains six 125 g yogurt pots for €3.60.
The total quantity is:
6 × 125 g = 750 g
The price per kilogram is:
3.60 ÷ 0.75 = €4.80/kg
Another offer contains four 150 g pots for €3.00.
The total quantity is:
4 × 150 g = 600 g
The price per kilogram is:
3.00 ÷ 0.60 = €5.00/kg
The first multipack has the lower unit price.
However, the best purchase also depends on whether you will use the full quantity before it spoils.
A lower unit price does not guarantee lower total spending or less waste.
Is the cheapest price per kilogram always best?
No.
Consider two packages of mushrooms:
| Package | Price | Price per kg |
|---|---|---|
| 250 g | €1.79 | €7.16 |
| 500 g | €2.99 | €5.98 |
The larger package is cheaper per kilogram.
But if you need only 250 g and have no realistic use for the remainder, the smaller package costs less at checkout.
For household budgeting, distinguish:
- Unit price.
- Total purchase price.
- Quantity actually consumed.
- Quantity wasted.
Buying extra food only because its unit price is lower may increase total spending.
Recognizing misleading comparisons
A comparison may produce the wrong conclusion when:
- One price is promotional and the other is regular.
- Package weights refer to different edible quantities.
- The products have different concentrations.
- The product formulation has changed.
- One package is a multipack and the other is not.
- The units are mixed, such as grams and milliliters.
- A previous price was recorded without a date.
- A larger package is compared with a smaller one without conversion.
Correcting these issues is often more valuable than collecting hundreds of poorly comparable prices.
Shrinkflation versus ordinary price inflation
Traditional price inflation refers to rising prices over time.
Shrinkflation refers to a reduction in the amount of product supplied while the shelf price stays unchanged or does not fall proportionally.
Both can increase the cost per unit.
From the buyer's perspective, the unit-price calculation captures the combined effect.
However, a higher unit price alone does not prove that a manufacturer intentionally used shrinkflation.
Packaging, product formulation, retailer pricing and other factors may have changed.
Describe what you can verify: the previous size, the new size, the previous price and the new price.
Avoid attributing motives without evidence.
A five-minute comparison method
When you notice a possible package change:
- Record the old price and quantity.
- Record the new price and quantity.
- Convert both quantities to the same unit.
- Calculate both unit prices.
- Calculate the percentage change.
- Check whether the product specification is still comparable.
- Save the observation with its date.
For example:
Old: €2.80 for 700 g.
New: €2.90 for 600 g.
Old unit price:
2.80 ÷ 0.7 = €4.00/kg
New unit price:
2.90 ÷ 0.6 = €4.83/kg
Effective increase:
((4.833... ÷ 4.00) − 1) × 100 = 20.8%
The shelf price increased only about 3.6%, but the unit price increased about 20.8%.
Using price records for meal planning
Unit-price history becomes more useful when connected to the quantities your household actually needs.
Suppose your weekly meal plan requires 800 g of rice.
If the current unit price is €2.50/kg, the ingredient cost is:
0.8 × 2.50 = €2.00
If the price rises to €3.00/kg, the same quantity costs:
0.8 × 3.00 = €2.40
The increase for that planned quantity is €0.40.
This is more actionable than simply knowing that a package costs more.
You can compare alternative brands, adjust recipes or use existing pantry supplies while preserving the planned portions.
What grocery price data cannot tell you
A personal price tracker can reveal meaningful changes in the products and stores you observe.
It cannot automatically establish:
- National food inflation.
- The average price paid by all consumers.
- Whether a manufacturer acted intentionally.
- Why a particular retailer changed its prices.
- Whether one store is consistently cheaper for every household.
Your observations depend on the stores, dates, products and promotions included.
For broader economic trends, use official statistical sources rather than extrapolating from a small shopping basket.
For personal budgeting, however, a carefully maintained record can still be highly useful.
The practical conclusion
To compare grocery price increases fairly, always calculate the price for the same amount of comparable food.
A package that becomes 10% smaller at the same shelf price is effectively about 11.1% more expensive per kilogram or liter.
When both the price and quantity change, compare the old and new unit prices directly.
Record dates, product specifications and promotions, and keep fixed-basket price changes separate from actual household spending.
The goal is not to collect the most prices. It is to collect prices that can be compared meaningfully.