
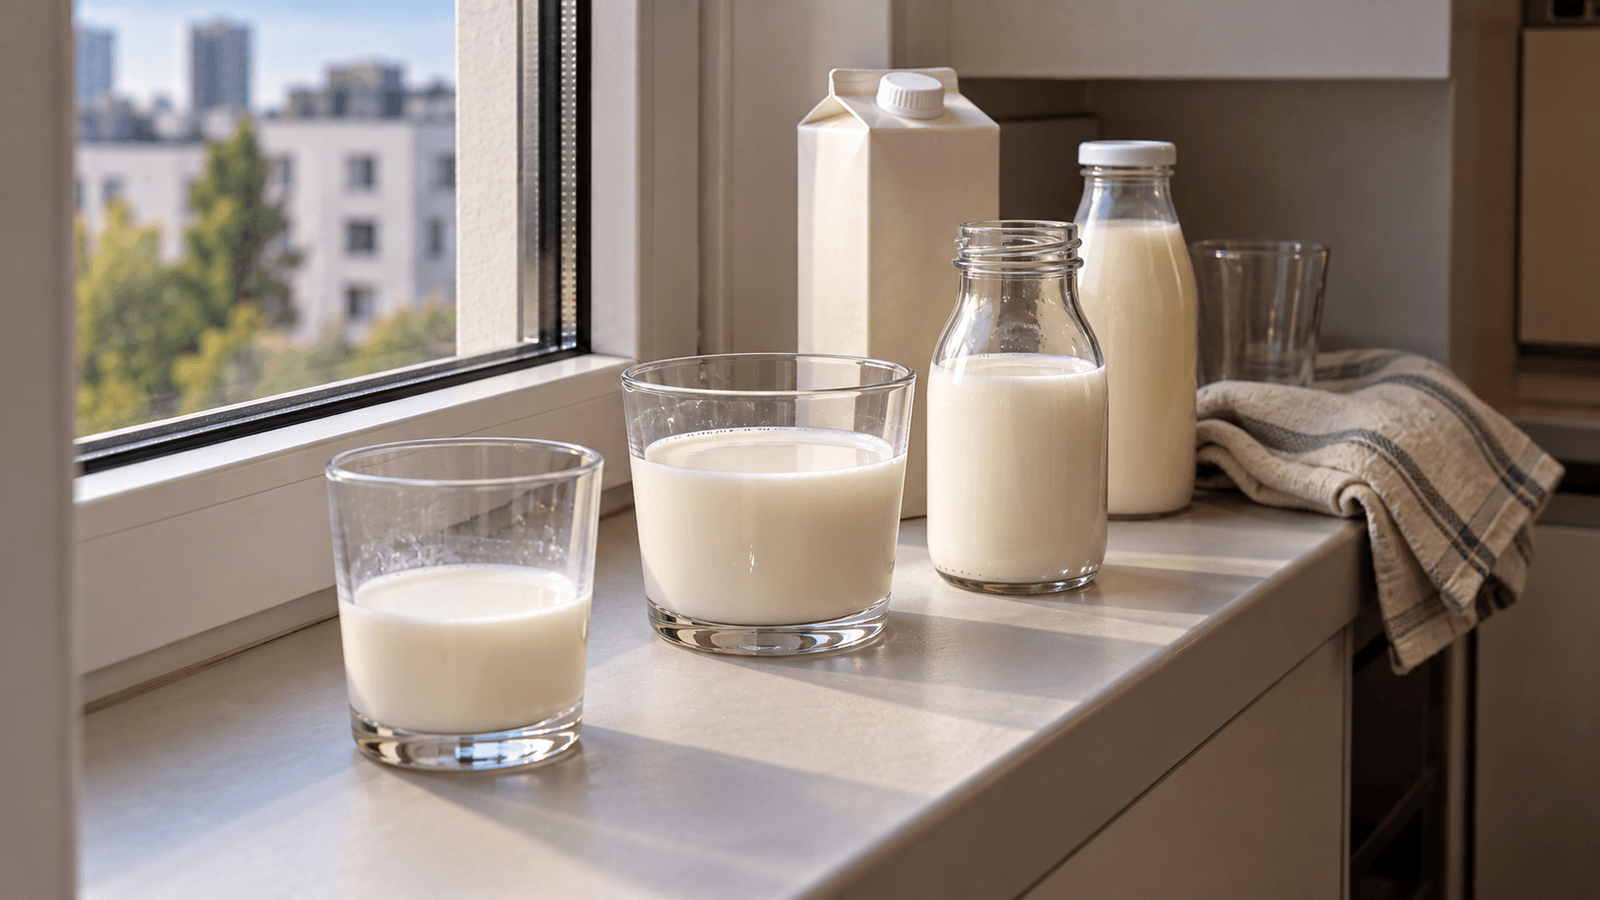
Milk can vary noticeably in calories even when the serving size looks identical.
The main reason is fat content. Whole milk contains more energy than reduced-fat or skim milk, while protein and carbohydrate levels are usually much closer.
Exact values vary slightly by country and product, so the package label remains the best source when you are tracking a specific milk.
Calories in milk per 100 ml
Typical plain cow's milk provides approximately:
| Type of milk | Calories per 100 ml | Protein | Carbohydrate | Fat |
|---|---|---|---|---|
| Whole milk, about 3.5% fat | 64 kcal | 3.3 g | 4.7 g | 3.5–3.6 g |
| Reduced-fat milk, about 1.5% fat | 46–47 kcal | 3.4 g | 4.8–4.9 g | 1.5–1.6 g |
| Skim milk, about 0.1–0.5% fat | 34–36 kcal | 3.4 g | 4.9–5.0 g | 0.1–0.5 g |
These are useful reference values rather than universal numbers. Processing, fat percentage and product formulation can produce small differences.
Calories by common serving size
Using typical values, common portions look roughly like this:
| Serving | Whole milk | 1.5% milk | Skim milk |
|---|---|---|---|
| 50 ml | ~32 kcal | ~23 kcal | ~18 kcal |
| 100 ml | ~64 kcal | ~47 kcal | ~35 kcal |
| 150 ml | ~96 kcal | ~70 kcal | ~53 kcal |
| 200 ml | ~128 kcal | ~94 kcal | ~70 kcal |
| 250 ml | ~160 kcal | ~118 kcal | ~88 kcal |
| 300 ml | ~192 kcal | ~141 kcal | ~105 kcal |
The difference becomes more noticeable as the portion increases.
A small amount in coffee may contribute relatively little, while several large milk-based drinks during the day can add substantially more.
How many calories are in a glass of milk?
There is no standard household glass size.
If your glass holds 250 ml, a typical serving contains approximately:
- 160 kcal with whole milk
- 118 kcal with 1.5% milk
- 88 kcal with skim milk
If the glass holds only 200 ml, the values are lower.
This is why recording “one glass” is less precise than recording millilitres.
If you use the same glass regularly, fill it normally once and measure how much it holds. After that, you can use the glass as a personal reference.
Why whole milk has more calories
Milk contains three main macronutrients:
- protein
- carbohydrate, primarily lactose
- fat
Fat provides more energy per gram than protein or carbohydrate.
Reducing the fat content therefore lowers the calorie density of milk even though the amount of protein and carbohydrate often changes relatively little.
This does not automatically make one milk type “better” than another. The appropriate choice depends on preferences, overall diet and what you want from the product.
Protein in milk
Cow's milk typically provides around 3.3–3.5 g of protein per 100 ml.
That means a 250 ml serving commonly provides around:
8–9 g protein
The difference in protein between whole and lower-fat milk is usually much smaller than the difference in calories. For packaged protein drinks compared with ordinary milk by serving, see protein drinks versus milk.
For someone choosing milk mainly for protein, portion size can therefore matter as much as the fat category.
Carbohydrates in milk
Plain cow's milk typically contains around 4.7–5 g of carbohydrate per 100 ml, primarily as lactose.
A 250 ml serving therefore commonly contains around:
12 g carbohydrate
Lower-fat milk does not necessarily contain dramatically less carbohydrate. Removing fat mainly changes the fat and calorie content.
Milk in coffee
Milk added to coffee is easy to underestimate because the drink may still look like “just coffee.”
Suppose you add 60 ml of milk.
Approximate contribution:
- whole milk: ~38 kcal
- 1.5% milk: ~28 kcal
- skim milk: ~21 kcal
One coffee may not make a large difference.
But if you drink four coffees using 60 ml of whole milk each, that is 240 ml of milk in total — roughly 154 kcal before adding sugar or other ingredients.
The useful approach is to track the amount you actually use rather than relying on the name of the drink.
Milk in cereal or oats
Milk poured over cereal or oats can be harder to judge visually than milk in a glass.
If accurate tracking matters to you, measure your usual amount once.
For example, you may discover that your typical bowl uses:
- 120 ml
- 180 ml
- 250 ml
Once you know your normal amount, you do not necessarily need to measure it every morning.
This is often faster than guessing from the finished bowl.
Does weighing milk work?
Yes, but millilitres are usually simpler when the nutrition label is given per 100 ml.
Milk is close to, but not exactly, the density of water.
For ordinary food logging, use the unit that matches the product label or database entry.
Avoid automatically assuming that every liquid has exactly the same number of grams and millilitres.
Milk used in recipes
When milk is part of a recipe, calculate it as one ingredient in the full recipe.
Example:
A recipe contains 500 ml of whole milk.
At approximately 64 kcal per 100 ml:
500 × 64 ÷ 100 = 320 kcal
If the recipe makes four equal servings, the milk contributes approximately:
320 ÷ 4 = 80 kcal per serving
The final calorie content of the meal depends on all the other ingredients as well.
For recipes you prepare repeatedly, saving the full recipe is usually easier than recalculating the milk every time.
Whole milk vs lower-fat milk: how large is the difference?
Consider a 250 ml serving:
- whole milk: ~160 kcal
- 1.5% milk: ~118 kcal
- skim milk: ~88 kcal
Switching from whole to 1.5% milk in that example changes the serving by roughly 42 kcal.
Switching from whole to skim changes it by roughly 72 kcal.
Whether that difference matters depends on how much milk you consume and your overall eating pattern.
If you use only 20 ml in one coffee, the difference is small.
If you drink several hundred millilitres each day, it becomes more noticeable.
Flavoured milk is different
Chocolate milk and other flavoured milks should not automatically be logged as plain milk.
They may contain:
- added sugar
- cocoa
- flavourings
- other ingredients
Their calorie and carbohydrate content can therefore differ substantially from plain milk.
Use the specific product label or database entry.
Lactose-free milk
Lactose-free cow's milk is not automatically lower in calories.
The lactose is generally broken down into simpler sugars rather than removed as energy.
The calorie content therefore depends largely on the milk's fat level and the specific product.
Track lactose-free milk using its own label rather than substituting a generic skim or whole milk entry.
Plant-based drinks are separate foods
Oat, soy, almond, coconut and other plant-based drinks can differ considerably from cow's milk and from each other.
Depending on the product, differences may include:
- calories
- protein
- carbohydrate
- fat
- added sugar
- fortification
Do not use a cow's milk entry to track a plant-based drink.
Even two oat drinks or two almond drinks can have different nutrition profiles, so use the exact product when possible.
How to track milk more accurately
For everyday calorie tracking:
- identify the milk type and fat percentage
- check the product label when available
- record the amount in ml
- measure frequently used cups or glasses once
- include milk used in coffee, cereal and recipes
- use the specific entry for flavoured, lactose-free or plant-based products
This is usually enough for useful accuracy without measuring every serving forever.
A practical portion reference
Think of milk portions by their actual use:
Small addition: 20–50 ml
Common in coffee or tea.
Moderate addition: 100–150 ml
Possible in cereal, oats or a smaller drink.
Standard drink: 200–250 ml
A common glass-sized portion.
Large milk-based drink: 300 ml or more
The difference between milk types becomes increasingly relevant.
These are practical examples, not official serving recommendations.
The main variables are simple
For plain cow's milk, most calorie differences come down to two questions:
- Which fat percentage are you using?
- How much are you actually drinking or adding?
Once those are known, milk is relatively straightforward to track.
For a specific packaged product, use its nutrition label whenever possible rather than treating reference values as exact.
Nutrition data sources and product differences
The records below describe only the named foods, fat levels and preparation states. USDA figures are per 100 g; manufacturer figures retain their stated unit. These sources do not independently prove every approximate figure in the article.
The listed USDA milk entry has 1% fat per 100 g; it does not directly support this article’s 1.5% and 3.5% examples per 100 ml.
USDA FoodData Central (search by FDC ID):