
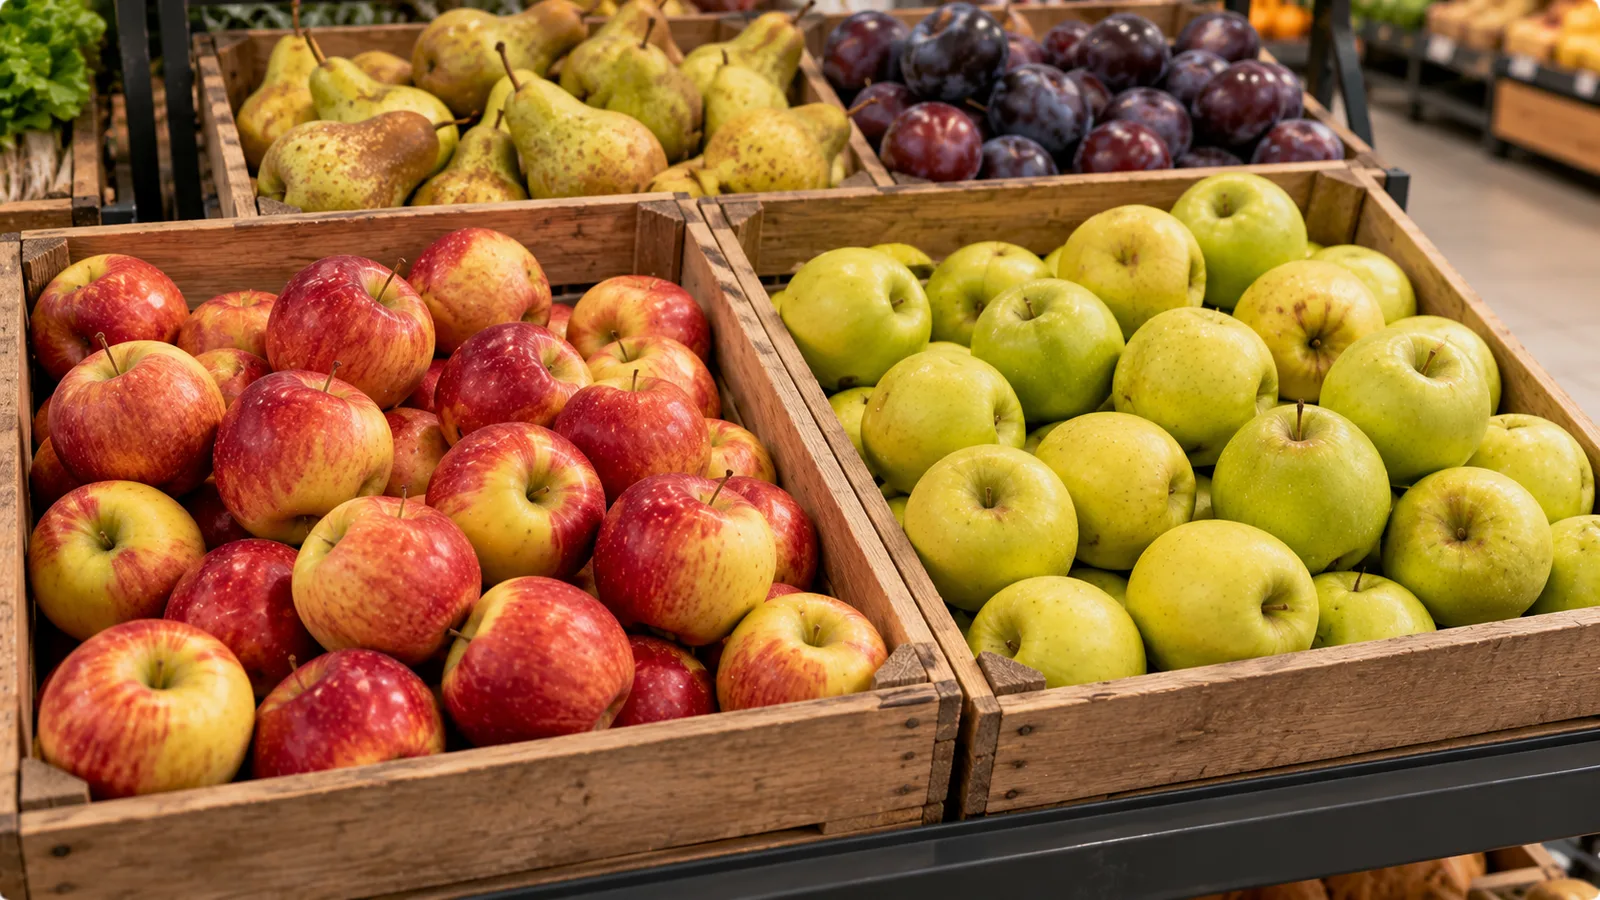
Seasonal fruit and vegetables are often described as cheaper, but that is not a reliable rule for every product, shop or week. A strawberry promotion in winter may temporarily beat a spring price. Locally grown vegetables can sometimes cost more than imported alternatives. Package sizes, quality and availability can also change.
If you want to spend less on groceries, the useful question is not simply whether a product is in season. It is whether its current comparable price is genuinely better than the alternatives available to you.
A small price history can answer that question more reliably than memory, advertising or a generic seasonal calendar.
What a seasonal price tracker should measure
A useful tracker records what you could actually buy, not a theoretical national average.
For each observation, capture:
| Field | Example | Why it matters |
|---|---|---|
| Date | 12 June | Shows when the price was available |
| Product | Strawberries | Identifies the food |
| Product specification | Fresh, conventional, whole | Prevents misleading comparisons |
| Shop | Supermarket A | Prices differ between retailers |
| Package size | 400 g | Reveals pack-size changes |
| Price paid or offered | €2.79 | Records the observed amount |
| Comparable unit price | €6.98/kg | Makes quantities comparable |
| Promotion | Yes | Separates temporary discounts |
| Origin, if shown | Germany | Adds context without assuming quality |
| Notes | Discounted near closing | Explains unusual observations |
You do not need to record every fruit and vegetable in the shop. Start with products you purchase regularly.
A tracker with six consistently monitored products is often more useful than a large list updated only once.
Always compare the same unit
A lower package price does not necessarily mean a lower food price.
Suppose a shop offers:
- 400 g of strawberries for €2.79.
- 500 g of strawberries for €3.19.
Calculate:
Price per kilogram = package price ÷ package weight in kilograms.
First package:
€2.79 ÷ 0.4 = €6.98/kg, rounded.
Second package:
€3.19 ÷ 0.5 = €6.38/kg.
The €3.19 package costs more at checkout but is cheaper per kilogram.
The same principle applies to apples, tomatoes, carrots and many other products.
For produce sold individually, record the item price and, when practical, its actual weight. Do not compare a price per item with a price per kilogram without converting them.
Decide what counts as the same product
Price tracking becomes misleading when different products are treated as interchangeable.
Examples of potentially important differences include:
- Loose tomatoes versus packaged cherry tomatoes.
- Conventional versus organic produce.
- Whole carrots versus peeled or prepared carrots.
- Fresh spinach versus frozen spinach.
- Premium berries versus standard varieties.
- Ripe discounted fruit versus fruit intended to last several days.
You can track these alternatives, but keep their specifications visible.
For example, a frozen berry price can be a useful alternative to fresh berries for smoothies. It should not automatically be interpreted as the seasonal price of fresh berries.
If your goal is to buy whichever product works for a recipe, compare alternatives separately and then decide whether they meet the same culinary need.
Build a baseline before judging seasonality
One low price is not enough to establish a seasonal pattern.
Start with a simple baseline based on your own observations.
For example, imagine you recorded the following prices for ordinary fresh tomatoes:
| Observation | Price per kg |
|---|---|
| Week 1 | €3.49 |
| Week 2 | €3.19 |
| Week 3 | €3.79 |
| Week 4 | €2.99 |
The average is:
(3.49 + 3.19 + 3.79 + 2.99) ÷ 4 = €3.37/kg.
This is your observed four-week average, not an official market average.
It gives you a reference for future comparisons.
A longer history is better for identifying recurring seasonal patterns. Ideally, collect observations across a full year before making confident statements about which months are consistently cheaper.
Use a median when promotions distort the average
Averages can be pulled downward by unusually cheap promotions or upward by exceptional prices.
Suppose five observations are:
€2.99, €3.19, €3.29, €3.49 and €1.49 per kilogram.
The average is:
(2.99 + 3.19 + 3.29 + 3.49 + 1.49) ÷ 5 = €2.89/kg, rounded.
The median, or middle value after sorting, is €3.19/kg.
The unusually cheap €1.49 offer lowers the average substantially.
Neither measure is universally superior.
Use the median when you want to understand a typical observed price. Use the average when you want a simple arithmetic summary of the prices you recorded.
For a reliable comparison, retain the individual observations rather than saving only the summary.
Separate regular prices from promotions
Promotions are valuable for shopping decisions, but they can distort an estimate of the usual seasonal price.
Keep a simple promotion flag:
| Date | Regular price | Observed promotional price | Promotion? |
|---|---|---|---|
| 3 May | €4.49/kg | €4.49/kg | No |
| 10 May | €4.49/kg | €2.99/kg | Yes |
| 17 May | €3.99/kg | €3.99/kg | No |
The table is illustrative.
If your objective is to find the lowest available buying price, include promotions.
If your objective is to estimate whether the underlying price tends to decline during a season, examine non-promotional observations separately.
Avoid assuming that a price labeled as a discount is automatically a good deal. Compare its unit price with your own recent history.
How often should you record prices?
Weekly observations are a practical starting point for frequently purchased produce.
Daily recording is usually unnecessary for an ordinary household budget.
A simple schedule might be:
- Once a week: record prices for your core products.
- When shopping: add the actual price paid.
- When a major promotion appears: record it with a promotion flag.
- Once a month: review the price history.
- After twelve months: compare the same product across seasons.
Consistency matters more than collecting a large number of irregular observations.
If you shop at different retailers, record the shop name. Otherwise, a retailer change may look like a seasonal price movement.
Example: comparing strawberry prices across months
Imagine you collected these hypothetical monthly median prices for comparable fresh strawberries at the same retailer:
| Month | Median observed price |
|---|---|
| February | €9.90/kg |
| March | €8.20/kg |
| April | €6.90/kg |
| May | €5.40/kg |
| June | €4.80/kg |
| July | €5.60/kg |
| August | €7.10/kg |
This example illustrates a possible pattern. It is not real historical market data.
In this sample, June is the cheapest observed month.
The difference between February and June is:
€9.90 − €4.80 = €5.10/kg.
As a percentage of the February price:
€5.10 ÷ €9.90 × 100 = 51.5%, approximately.
That is a difference within this fictional dataset, not a prediction of actual strawberry prices.
Real prices may behave differently depending on weather, supply, region, retailer and promotions.
Track the cost of the usable portion
The cheapest price per kilogram does not always produce the lowest cost per edible kilogram.
Some products contain peels, cores, stems or damaged portions that are not used.
A useful calculation is:
Cost per usable kilogram = purchase cost ÷ usable weight in kilograms.
Suppose you buy 1 kg of vegetables for €2.50 but use only 800 g after trimming.
The cost per usable kilogram is:
€2.50 ÷ 0.8 = €3.13/kg, rounded.
Compare this with a prepared alternative costing €3.60 per usable kilogram.
The unprepared product is still cheaper in this example, but the difference is smaller than the shelf prices alone suggest.
Use realistic yield estimates based on how you prepare the food. Do not assume every household discards the same amount.
Compare fresh, frozen and canned alternatives fairly
Seasonal price tracking is particularly useful when a recipe can accept different forms of produce.
For example, compare:
- Fresh spinach, weighed before preparation.
- Frozen spinach without added sauce.
- Canned spinach, using drained weight where appropriate.
The products may differ in water content, texture, cooking behavior and edible yield.
A simple shelf-price comparison may therefore be misleading.
For smoothies, frozen berries may substitute for fresh berries. For a raw fruit salad, the same substitution may not work.
Track alternatives as separate products, then compare them for the specific meal you intend to prepare.
Add the price tracker to meal planning
A price history becomes most useful when it changes shopping decisions.
Imagine your weekly plan includes:
- A tomato pasta sauce.
- A roasted vegetable tray.
- A fruit-and-yogurt breakfast.
- A vegetable soup.
If tomatoes are expensive relative to your recent observations, you could use canned tomatoes in the sauce when suitable.
If courgettes are comparatively cheap, they may be a practical choice for roasting.
If fresh berries are unusually expensive, another fruit or frozen berries may work for breakfast.
The important step is to adapt the meal without buying ingredients that will not be used.
A cheaper ingredient does not save money if it creates waste or requires several additional purchases.
Calculate savings against a meaningful baseline
Suppose your usual comparable price for a vegetable is €3.80/kg.
This week, the same product specification is available for €2.90/kg.
You plan to buy 1.5 kg.
Estimated difference:
(€3.80 − €2.90) × 1.5 = €1.35.
This is a saving relative to your chosen baseline, not necessarily a saving compared with every other shop.
If you would normally buy only 500 g, purchasing an extra kilogram solely because of the discount is not automatically economical.
A meaningful savings calculation should use the quantity you will actually consume.
Avoid false conclusions from small datasets
Seasonal price patterns are influenced by more than the calendar.
Possible factors include:
- Weather and harvest conditions.
- Import availability.
- Transport and energy costs.
- Retailer pricing policies.
- Product variety and quality.
- Local demand.
- Promotions and stock clearance.
- Changes in package size.
A handful of observations cannot isolate the effect of seasonality from these other factors.
Describe early findings as observations, not universal rules.
For example, write:
“Strawberries were cheaper in my recorded June observations than in February.”
Avoid writing:
“Strawberries are always cheapest in June.”
A simple spreadsheet structure
A basic spreadsheet needs only one observation per row.
| Date | Product | Specification | Shop | Weight kg | Price € | €/kg | Promotion |
|---|---|---|---|---|---|---|---|
| 05-05 | Tomatoes | Loose, conventional | A | 0.8 | 2.79 | 3.49 | No |
| 12-05 | Tomatoes | Loose, conventional | A | 1.0 | 2.99 | 2.99 | Yes |
| 19-05 | Tomatoes | Loose, conventional | A | 0.6 | 2.09 | 3.48 | No |
For a spreadsheet where column E contains weight in kilograms and column F contains price, the unit-price formula in G2 is:
`=IFERROR(F2/E2,"")`
Copy it down for subsequent rows.
If you record an advertised unit price without buying the product, you can enter that price directly and mark the observation as an offer rather than a purchase.
Do not invent a package weight merely to make the formula work.
Monthly review: what should you look for?
Once a month, review each tracked product.
Ask:
- What was the median comparable price?
- What was the lowest observed price?
- Were the lowest prices promotional?
- Did the product specification stay consistent?
- Was a cheaper alternative suitable for your recipes?
- Did you buy more than you actually used?
- Are prices moving in a similar direction across several weeks?
After a full year, compare the same months or seasons while keeping retailer and product differences in mind.
You can also compare year-over-year prices, but remember that inflation and changes in supply may affect the results.
When a seasonal calendar is still useful
A seasonal calendar can help identify when certain produce is commonly harvested or more readily available in a region.
It is useful as a planning clue, not as proof of a low price.
A product may be in season locally but expensive because of poor harvest conditions.
Another product may be inexpensive outside its local growing season because imports are plentiful.
Use the calendar to decide which products to watch more closely, then use actual prices to make the buying decision.
Common mistakes in seasonal price tracking
Comparing different package sizes without converting them. Always use a comparable unit.
Mixing organic and conventional products. Keep specifications separate.
Treating one promotion as a seasonal trend. Record promotions and ordinary prices separately.
Ignoring the shop. Retailer differences can be larger than a short-term seasonal movement.
Using prices from memory. Keep dated observations.
Buying excess produce because it is cheap. Consider how much you can realistically use.
Assuming a lower shelf price means a lower usable-food cost. Account for trimming and waste when relevant.
A realistic starting plan
You can begin without specialized software.
Choose five to eight fruits and vegetables that appear regularly in your meals.
Record their comparable prices once a week for three months.
During that period, focus on reliable data collection rather than trying to identify a perfect seasonal pattern.
After three months, you may already have useful personal buying benchmarks.
After twelve months, you can begin examining whether certain periods repeatedly show lower prices.
The tracker becomes more valuable as its history grows, provided you continue comparing like with like.
Final takeaway
The most reliable way to track seasonal produce prices is to record actual, comparable prices over time.
Use price per kilogram, preserve product and retailer details, separate promotions, and compare repeated observations rather than relying on a single offer.
Seasonal calendars can suggest what to monitor, but your own dated price history shows what was actually affordable where you shop.
A useful tracker does not need to be complicated. It needs consistent units, realistic purchase quantities and enough observations to support the conclusions you draw.