
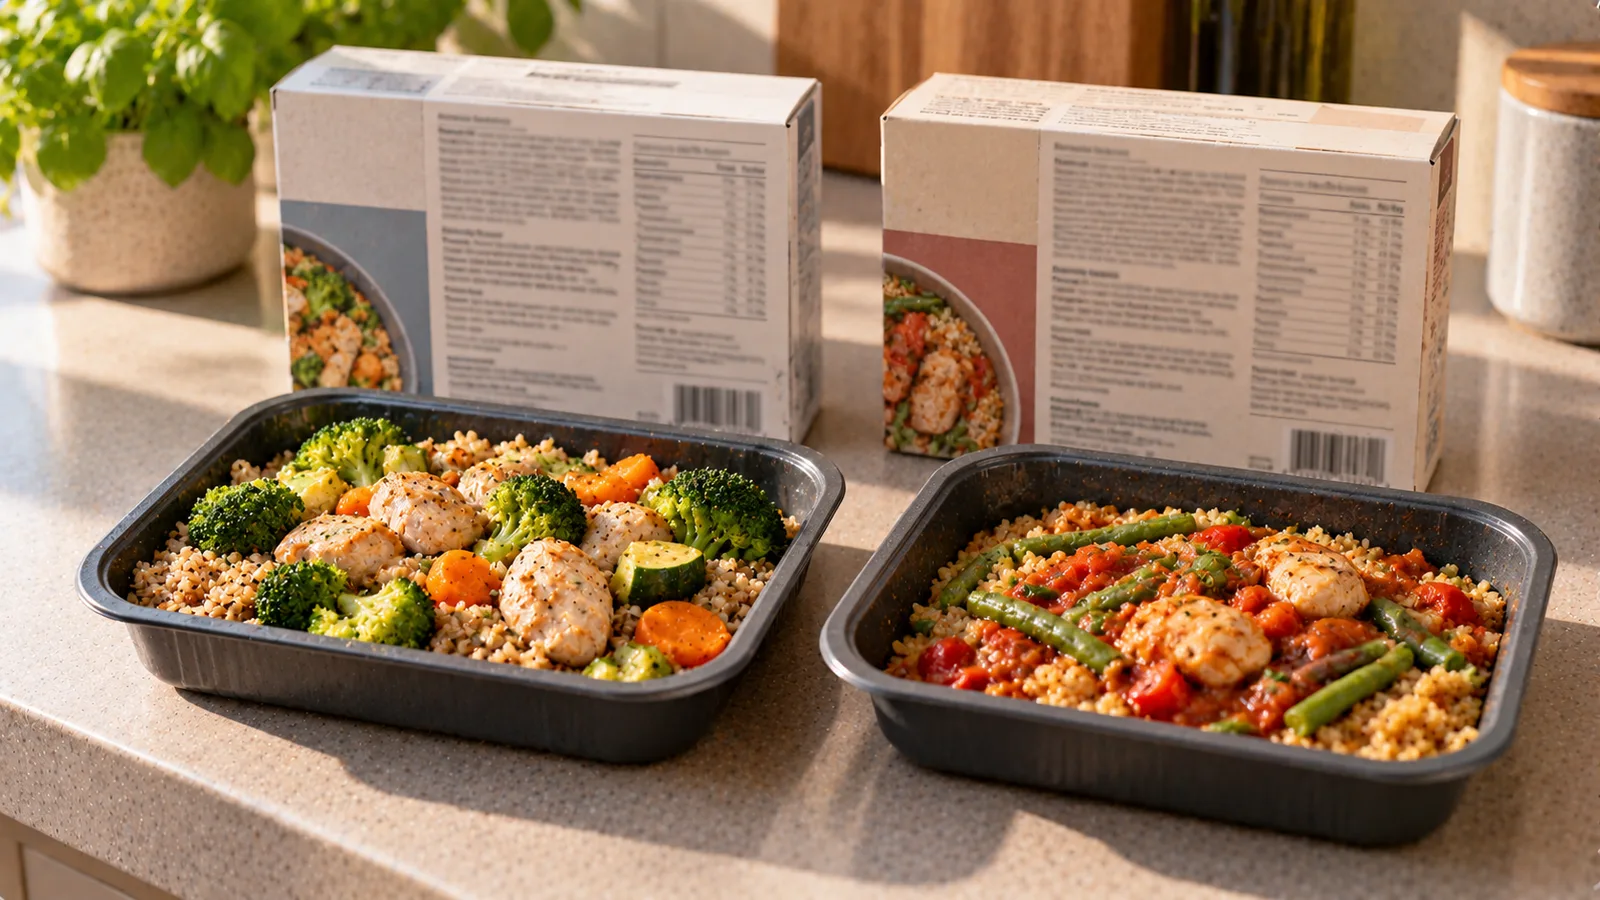
Ready meals can look similar on the shelf while differing substantially in calories, protein, vegetables, fiber, salt and portion size.
The most useful comparison is rarely based on a single number. Instead, compare meals on the amount you will actually eat and then look at the nutrients that matter for the role that meal needs to play.
Start with the amount you will actually eat
Before comparing calories or nutrients, check the package size and serving information.
A ready meal may show nutrition:
- per 100 g;
- per serving;
- per half package;
- for the whole package.
These are not interchangeable.
Suppose Meal A contains 350 g and Meal B contains 500 g. Both labels show values per 100 g.
If you intend to eat the whole package, comparing only the per-100-g numbers can give an incomplete picture.
The useful calculation is:
value per 100 g × package weight ÷ 100
Example: compare the whole meal
Imagine two products:
| Meal A | Meal B | |
|---|---|---|
| Package size | 350 g | 450 g |
| Calories per 100 g | 130 kcal | 110 kcal |
| Protein per 100 g | 6 g | 5 g |
| Fiber per 100 g | 2.5 g | 3 g |
| Salt per 100 g | 0.8 g | 0.6 g |
At first glance, Meal B has fewer calories per 100 g.
But if you eat each entire package:
Meal A
Calories:
130 × 350 ÷ 100 = 455 kcal
Protein:
6 × 350 ÷ 100 = 21 g
Fiber:
2.5 × 350 ÷ 100 = 8.75 g
Salt:
0.8 × 350 ÷ 100 = 2.8 g
Meal B
Calories:
110 × 450 ÷ 100 = 495 kcal
Protein:
5 × 450 ÷ 100 = 22.5 g
Fiber:
3 × 450 ÷ 100 = 13.5 g
Salt:
0.6 × 450 ÷ 100 = 2.7 g
The lower-calorie product per 100 g is actually slightly higher in calories for the full package.
At the same time, it provides more fiber and slightly more protein.
There is no universal winner: the better choice depends on what you need from the meal.
Compare calories on the same basis
When comparing two ready meals, first put them on the same basis.
Use either:
- per 100 g for product-to-product comparison; or
- the actual portion you will eat for meal-level comparison.
The second approach is usually more useful when choosing lunch or dinner.
A 300 kcal package and a 600 kcal package are very different meals even if their per-100-g values look similar.
Look at protein in the whole meal
Protein per 100 g can be useful, but total protein in the portion matters more.
For example:
Meal A:
- 5 g protein per 100 g;
- package: 300 g.
Total:
5 × 300 ÷ 100 = 15 g protein
Meal B:
- 7 g protein per 100 g;
- package: 400 g.
Total:
7 × 400 ÷ 100 = 28 g protein
This makes the difference much easier to interpret.
Check what provides the protein
The ingredient list adds context to the nutrition table.
Protein may come from ingredients such as:
- chicken;
- fish;
- eggs;
- beans;
- lentils;
- tofu;
- dairy products;
- meat alternatives.
A prominent “high protein” message on the front of the package should not replace checking the actual protein amount and ingredient list.
Look for vegetables in the ingredient list
A meal with vegetables pictured prominently on the package may not necessarily contain a large proportion of vegetables.
Check the ingredient list.
Ingredients are generally listed by weight, with the largest contributors appearing first under applicable labeling rules.
Depending on the product and market, percentages may also be declared for emphasized ingredients.
This can help distinguish between:
- a meal built around vegetables;
- a meal containing a modest vegetable component;
- a product where vegetables are mainly decorative or part of a sauce.
Fiber adds useful context
Fiber can help distinguish meals built from different carbohydrate sources.
Foods such as:
- beans;
- lentils;
- whole grains;
- vegetables;
- peas;
- certain seeds
can contribute fiber.
Compare the fiber amount for the portion you will actually eat when the label provides it.
A meal with more fiber is not automatically better in every situation, but fiber is a useful part of the overall comparison.
Check salt, not just calories
Ready meals can contribute a meaningful amount of salt.
In EU-style nutrition labeling, salt is generally shown directly.
For example, a meal containing 0.9 g salt per 100 g and weighing 400 g provides:
0.9 × 400 ÷ 100 = 3.6 g salt
That is very different from seeing only “0.9 g” and mentally treating it as the amount in the whole meal.
Always calculate for the portion actually eaten.
Sodium and salt are not the same label value
Depending on the country, a label may show sodium rather than salt.
Do not directly compare a sodium number from one label with a salt number from another as though the units represented the same quantity.
When comparing products across different labeling systems, first make sure the values refer to the same measure.
Fat can be useful, but context matters
Total fat is one part of the nutrition profile.
Also look at saturated fat when it is provided.
A higher-fat meal is not automatically a poor choice, and a low-fat meal is not automatically nutritionally superior.
The useful question is how the complete meal fits your needs alongside calories, protein, fiber, vegetables and salt.
Carbohydrates need context too
Two meals with similar carbohydrate totals may be built very differently.
One might contain:
- whole grains;
- beans;
- vegetables.
Another might contain:
- refined pasta;
- a sweet sauce;
- relatively few vegetables.
The nutrition table and ingredient list work best when read together.
Do not compare unrelated meals too mechanically
A vegetable soup and a pasta bake serve different purposes.
The soup may have fewer calories per 100 g largely because it contains much more water.
That does not automatically make it a more complete meal.
Comparisons are most useful between products that could realistically replace one another, such as:
- two lasagnas;
- two curry-and-rice meals;
- two grain bowls;
- two chicken meals;
- two vegetarian ready meals.
Water can change calorie density
Foods with more water often contain fewer calories per 100 g.
This matters when comparing soups, stews and sauce-heavy meals with denser foods.
A low calorie value per 100 g may partly reflect water content rather than a fundamentally different nutrient profile.
That is another reason to calculate the whole portion.
Front-of-pack claims are only a starting point
Packages may emphasize claims such as:
- high protein;
- source of fiber;
- reduced fat;
- plant based;
- no added sugar.
These statements can provide useful information, but they answer specific questions rather than describing the entire nutritional quality of the meal.
Use the nutrition table, portion size and ingredient list together.
A five-step comparison
When standing in front of two similar ready meals, use this sequence:
1. Check package size
How many grams will you actually eat?
2. Calculate whole-portion calories
Convert the per-100-g value to your real portion.
3. Calculate protein
Compare protein for the full portion, not only per 100 g.
4. Check vegetables and fiber
Use both the ingredient list and nutrition information.
5. Check salt
Calculate the salt for the portion you will eat.
This gives a much more useful comparison than choosing the product with the lowest calorie number on the front.
Worked comparison: two pasta meals
Consider two refrigerated pasta meals.
Tomato chicken pasta
Package: 380 g
Per 100 g:
- 125 kcal;
- 7.5 g protein;
- 15 g carbohydrate;
- 3.5 g fat;
- 2.0 g fiber;
- 0.65 g salt.
Whole package:
Calories:
125 × 380 ÷ 100 = 475 kcal
Protein:
7.5 × 380 ÷ 100 = 28.5 g
Fiber:
2 × 380 ÷ 100 = 7.6 g
Salt:
0.65 × 380 ÷ 100 ≈ 2.5 g
Creamy vegetable pasta
Package: 400 g
Per 100 g:
- 145 kcal;
- 4.5 g protein;
- 17 g carbohydrate;
- 6 g fat;
- 2.8 g fiber;
- 0.55 g salt.
Whole package:
Calories:
145 × 400 ÷ 100 = 580 kcal
Protein:
4.5 × 400 ÷ 100 = 18 g
Fiber:
2.8 × 400 ÷ 100 = 11.2 g
Salt:
0.55 × 400 ÷ 100 = 2.2 g
The first meal provides more protein and fewer calories. The second provides more fiber and slightly less salt.
The comparison reveals trade-offs rather than producing a simplistic “healthy” and “unhealthy” label.
Worked comparison: different package sizes
Now consider:
Meal C:
- 320 g package;
- 150 kcal per 100 g.
Meal D:
- 450 g package;
- 120 kcal per 100 g.
Meal C total:
320 × 150 ÷ 100 = 480 kcal
Meal D total:
450 × 120 ÷ 100 = 540 kcal
Meal D looks lighter per 100 g but contains more calories if the entire package is eaten.
This is one of the most useful checks when comparing ready meals.
When one package contains multiple servings
Some products contain more than one labeled serving even though a person may reasonably eat the whole package.
Suppose a 400 g package lists a serving as 200 g.
Per serving:
- 260 kcal;
- 12 g protein.
If you eat the whole package:
- calories: 520 kcal;
- protein: 24 g.
Always match the calculation to what you actually consume.
Compare ingredients after the numbers
Once calories, protein, fiber and salt have been compared, read the ingredient lists.
Questions worth asking include:
- Is there a meaningful vegetable component?
- What is the main protein source?
- What are the main carbohydrate ingredients?
- Are oils, cream or cheese major ingredients?
- Does the product contain legumes or whole grains?
- Are the foods pictured prominently actually substantial ingredients?
The goal is not to classify every ingredient as “good” or “bad.” It is to understand what the meal is made from.
What if the meal is too small?
A nutritionally reasonable ready meal may simply be too small for your needs.
Instead of rejecting it automatically, consider whether it can be completed with something simple, such as:
- vegetables;
- fruit;
- plain yogurt;
- a side of beans;
- whole-grain bread;
- another suitable food.
The relevant comparison is the complete meal you will actually eat.
What if the meal is larger than you need?
If a package is designed for more than one portion, you do not have to use the entire package as one serving.
Calculate the portion you plan to eat.
For example, a 500 g meal contains 600 kcal in total.
If you eat 350 g:
600 × 350 ÷ 500 = 420 kcal
The remaining 150 g contains approximately 180 kcal.
Price does not tell you nutritional quality
A more expensive ready meal is not automatically nutritionally superior.
Likewise, a cheaper product is not automatically worse.
Nutrition comparison and price comparison answer different questions.
When nutrition is the goal, use the label and ingredients rather than price or premium packaging as a proxy.
A practical comparison table
When comparing products, you can write down:
| Measure | Meal 1 | Meal 2 |
|---|---|---|
| Portion you will eat | ||
| Calories for portion | ||
| Protein for portion | ||
| Fiber for portion | ||
| Salt for portion | ||
| Main protein source | ||
| Vegetable content |
This keeps the comparison focused on the actual meal rather than isolated marketing claims.
What matters most?
There is no single ready-meal number that identifies the best option for everyone.
A practical comparison usually combines:
actual portion + calories + protein + vegetables + fiber + salt + ingredients
The weighting depends on your needs.
For example, someone looking for a more substantial lunch may care about adequate energy and protein, while someone whose other meals are already salty may give more attention to salt.
Quick decision rule
When two similar ready meals are in front of you:
- compare the amount you will actually eat;
- calculate calories for that amount;
- calculate protein for that amount;
- check vegetables and fiber;
- calculate salt for that amount;
- read the main ingredients;
- choose based on the complete picture rather than one front-of-pack claim.
A nutrition label becomes much more useful when it is converted from abstract values per 100 g into the numbers for the meal that will actually be on your plate.